


By Scott Opsal, CFA
Director of Equities, The Leuthold Group
The widespread popularity of smart beta ETFs demonstrates that factor-based investing has advanced from the province of academia to rank among the most popular investment strategies for institutional and retail investors. Originally of interest to researchers looking to test, and ultimately disprove, the efficient market hypothesis, factor analysis has now become a staple in the toolbox of quantitative and fundamental managers alike.
In November’s Perception for the Professional we launched our smart beta and factor investing research; we raised some important questions to ask while evaluating these new mass-market quantitative funds. This month, we delve deeper into factor returns and risk, with a particular focus on market cycles, one of our favorite topics. The broad acceptance and recent success of factor-based investing creates the behavioral risk that investors will begin to see it as a surefire moneymaker, a cure-all for their portfolio shortcomings. This research note explores the cyclicality of factors and discusses how they can be used to build a robust investment strategy; yet we caution against viewing factors as the superheroes of the investment universe.
Factor Returns
Our research examines eleven smart beta factors (represented by indexes from S&P and MSCI), and presents historical information on return spreads, correlations, and the influence of market cycles on the success of each factor.
Our factor lineup includes several pairs of related measures: 1) Low Volatility and Minimum Volatility; 2) High Dividend Yield and Dividend Aristocrats; and, 3) Small Cap and Equal Weighted. In the interest of research curiosity, both members of each pairing were included. We begin our analysis with relative return data shown in Table 1, calculated as the monthly spread between the factor’s return and the core or standard index. For ease of interpretation, to approximate annual data, monthly return spreads are multiplied by twelve.
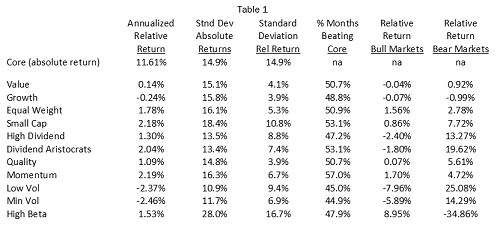
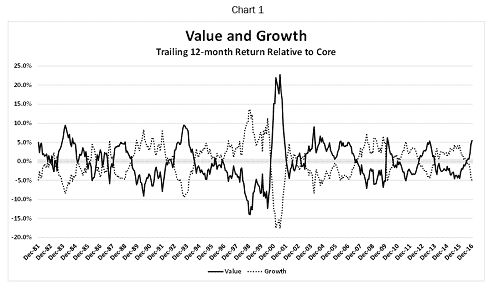
Our first finding is that, after 35 years of give-and-take, the Value and Growth styles ended 2016 in nearly a dead heat. Thus, as a matter of mathematical form, neither style has any real edge on the core index since our study began in 1981. Chart 1 illustrates that Value has had a tough go of it over the last decade (lagging Growth by almost 3% per year) until regaining the upper hand in 2016. This pattern highlights the primary theme of our findings: factor returns are cyclical, volatile, and unstable over time.
Looking beyond this traditional style distinction, Table 1 indicates that most smart beta factors carry positive excess returns in the range of 1.0% to 2.2%; values consistent with other quantitative research and with our own intuitive expectations of long-term alpha generation from active management. (Yes, factor investing is active management!) Note that factor indexes are long-only portfolios, whereas academic factor research typically goes long the top ranked securities and short the lowest ranked securities. The long-short nature of academic research means excess return can be captured from both ends of the spectrum, thus academic return results are usually larger than long-only index returns as shown here.
The two volatility factors are the only meaningful laggards among the eleven factors, posting negative return spreads of more than 2%. This brings to light an important caveat of Low/Min Volatility investing—the need to differentiate between absolute and risk-adjusted results. Low Volatility’s standard deviation of returns is 10.9% compared to the market’s 14.9%, so on a risk adjusted basis the return shortfall is offset by the reduced volatility. Low/Min Volatility may show positive risk-adjusted excess returns because they are low risk strategies (i.e. the risk penalty is much lower), but on an absolute basis Low/Min Volatility does not show excess return. Each investor must decide whether an absolute or risk-adjusted perspective best fits their investment circumstances.
Dividend strategies also have lower return volatility, not surprising given that a larger portion of their return comes from stable dividend streams. On the flip side, return volatility for High Beta and Small Cap are above the market’s level, indicating that the excess return from these factors is delivered in a bumpier fashion.
The fourth numeric column in Table 1 shows the percentage of months in which the factor’s excess return was positive. Given the positive alpha generally associated with factor returns, we were surprised to see the hit ratios so close to 50%. Momentum is the standout performer with 57% of months showing positive spreads; Small Cap and Dividend Aristocrats also managed to put a little daylight between their hit rates and even money. Volatility measures ranked poorest on this metric, to be expected given that the market is up more often than not, and Low Volatility has a difficult time keeping up in rising markets. Reinforcing the theme of this report, factors do offer excess return but they are by no means winners in all seasons, and in the short run are barely better than a coin flip.
Bull And Bear Markets
We believe market phases or cycles are critical to understanding any investment approach. We applied this perspective to our factor analysis by identifying bull and bear market phases since 1980 and segmenting factor returns based on this distinction. Reviewing the last two columns in Table 1, we were surprised by the modest alpha most factors experienced in bull markets. Only High Beta earned more in bull markets than it did overall, posting a 9.0% excess return in up markets. The other ten factors had bull market alphas lower than their overall scores and six are negative. Both dividend measures underperformed in bull markets, and volatility factors lagged significantly. Looking beyond High Beta, Size and Momentum appear to be the next most favorable exposures during bull runs.
While factor returns leave something to be desired in bull markets, they blow the doors off in bear markets. Aside from High Beta’s horrific results, most others performed extremely well, led by the dividend and volatility pairs which have double-digit spreads. Quality and Momentum also did nicely, and the Value/Growth style call performed as expected but to a more muted degree than the factors themselves.
The lesson from these columns is that factors can hold their own in bull markets (and selectivity is not important as long as you avoid Low/Min Volatility), but they shine in bear market cycles, delivering outstanding value-add across the board. Clearly, understanding market phases is critical to anticipating factors’ excess return going forward.
Factor Return Potential
Another perspective on the attractiveness of factor investing is shown with the data in Table 2. We created a metric called “Alpha Potential” defined as the percentage of rolling 12-month windows in which the absolute value of the factor’s excess return exceeded 5%—a level we selected as meaningful without being gaudy. This could be 5% outperformance (tilt overweight) or 5% underperformance (tilt underweight); in either case our goal was to identify how often successful factor selection could result in meaningful performance differentials. A factor that hugs the core benchmark offers few opportunities for active management and value-added returns, while a factor that regularly deviates from the core offers more frequent occasions to profit.
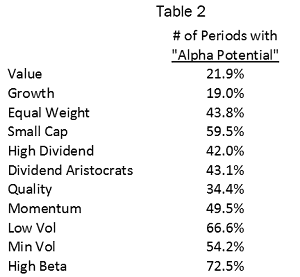
For example, versus the standard S&P 500, the Equal Weighted S&P 500 had a return spread of more than 500 basis points in nearly 44% of all rolling 12-month periods; some spreads were positive, others negative. This ratio can be interpreted as the potential number of periods that provide a consequential reward for getting the factor exposure right. If an investor’s process can tilt toward or away from the factor at the appropriate times, a higher alpha potential count is an attractive feature. Of course, a higher percentage of wide relative returns also creates greater tracking error (which some investors may view as a negative feature that accompanies the increased potential for making profitable tilts). Aside from Value and Growth, all the smart beta factors seem to provide plenty of opportunity for active decisions, led by High Beta’s tendency to mis-track the core index by at least 5% nearly three-quarters of the time.
Factor Correlation
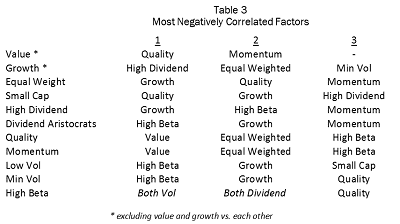
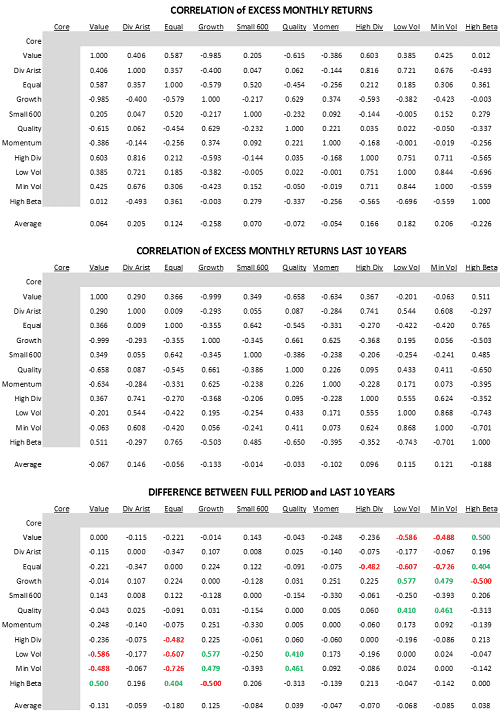
One of the most attractive aspects of factor investing is that the correlation of monthly excess returns across factors is very low. This means diversification can play an important role in portfolio design and multi-factor portfolios are likely to be more attractive than single factor options. We provide full-period and ten-year correlation tables on the “Appendix” page of this section; and a quick scan of the top two sections reveals broad swaths of negative correlations. An abbreviated look at correlations is shown in Table 3, which captures the theme that diversification opportunities abound for portfolios that mix factors together.
A clear understanding of market cycles and phases is necessary to properly interpret return correlations, which can be affected by: (a) market conditions; and/or, (b) changing constituents within each factor. Consider, for example, the market’s recent desire for low volatility, high yield, bond-substitute equities. Stable dividend payers generated excess return and rising valuations as they gained in popularity, which also impacts historical correlations. The bottom section of the Appendix Table measures the change in correlations between the entire time frame and the last ten years. We notice several relationships that may have been affected by the low-vol/high dividend market phase, for example: (1) Value and Size have become less correlated with Low/Min Volatility and Yield, while Growth has become more correlated, as the dividend payers have become more expensive over time; and, (2) Value and Equal Weight have become more correlated with High Beta, while Growth is less correlated. The High Beta index today is dominated by Financials and Energy due to the macro uncertainty of these sectors. In other times, we expect the greatest uncertainty to rest elsewhere, changing the High Beta correlations once again.
The Tech Bubble
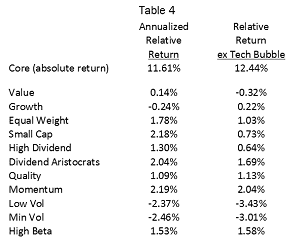
The exaggerated, even grotesque, return patterns of the tech bubble era distorted all sorts of market metrics and cast doubt on research that includes that period. Our concern is whether the return advantage of various factors is primarily due to the tech bubble era, or whether they are robust across the longer time frame. We examined the tech bubble influence on factor performance by recalculating Table 1 excluding the 12 months on either side of the March 2000 top. Table 4 presents the original excess return results along with the findings not including those 24 months.
Eliminating the tech bubble climax had a slight negative impact on factor spreads overall, but the results generally remain above zero. Ignoring this window of time dampens the overall gains but still leaves some excess return to be had. Interestingly, it was the unwinding of the tech bubble, rather than the run up, that boosted overall factor returns. Several factors have a conservative, blue chip low-risk profile and made tremendous gains as the bubble collapsed.
While factors are generally profitable, they do have extended periods of underperformance and can post significant drawdowns relative to a core index. Continuing with our focus on the tech bubble period, we cataloged the maximum and minimum trailing 12-month return relative to the core index during that market cycle. Table 5 is divided into two groups; the upper group experienced its high point in relative return before the tech bubble top, while the lower group posted its best numbers after the bubble popped. (High Beta had several highs before the top so it’s included in the upper group.)
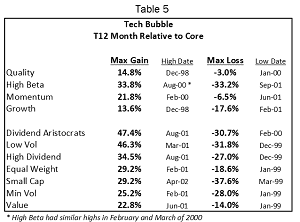
Consistent with their tendency to hold aggressive names in an up market, High Beta and Momentum performed as expected by reaching their relative highs in early 2000. Quality and Growth peaked in late 1998 just before the market narrowed in the final blow-off stage of the mania. We are particularly impressed with Momentum’s nimbleness in limiting the damage as the market unwound, its worst 12-month shortfall being just one-third of its maximum relative gain as the market sold off.
Dividend Payers, Low Volatility, Small Caps, and Value stocks all lagged badly in the upswing but generally earned that back, and more, in the reversal that followed. Investors who prefer modestly valued, blue chip dividend-paying stocks across the market cap spectrum (that is, many fundamental investors) needed remarkable conviction and staying power in the whirlwind months leading up to March of 2000, and those who held fast to their style reaped incredible relative gains on the way back to normalcy.
The tech bubble’s massive factor spreads provide a clear picture of the importance of market cycles on factor returns. We believe investment styles in general, and factor selection in particular, will always depend on a favorable market phase; the highest ambition for factor investors is to develop a sense of perspective and timing that enables them to tilt for—or against—factors as the market moves through its inevitable cycles.
Research Takeaways
- For smart beta investors or investors using factors as part of their security selection process, factors have positive alpha over time.
- Market cycles and phases are critical. Bull market excess returns are skimpy but bear markets can be particularly rewarding for the conservatively biased factors.
- Correlation is unstable due to market phases and changing membership within factors. Select your historical timeframe carefully.
- The ability to successfully tilt toward or away from factors, depending on market conditions, is a valuable skill.
Future factor research from us will explore topics such as: (a) the changing makeup of factor constituents over time; (b) identifying fundamental drivers of excess return; and, (c) investigating the potential for timing factor exposures. Stay tuned!
Appendix
Appendix Table:
© 2017 The Leuthold Group