


By Nicolas Rabener, FactorResearch
Are Factor Returns Limited to Small Caps?
Summary:
- A frequent criticism of factor investing is that factor returns are stronger in small caps;
- Our research highlights that this is not uniformly true across factors; and
- Value and Size benefit most from including small caps.
INTRODUCTION
Factor investing can be challenged in many ways. Nearly all of the research is based on backtesting of financial data, not on realized returns. The few factor products that have a live track record of close to 20 years show significant differences to the theoretical returns (please see our research report Smart Beta vs Factor Returns). Transaction costs are typically excluded from research, which tend to have meaningful impact in reality. Fama-French data, a great free resource, which we often use in our analysis given that the data goes back to 1926, includes companies with very small market capitalizations. The later criticism, i.e. that the stocks used in research need to be investible is important for institutional investors as they are often constrained from trading companies with too small market capitalizations. In this short research note we will analyse the difference in factor returns for companies with small and large market capitalizations (“caps”).
METHODOLOGY
We focus on the six well-known factors (Value, Size, Momentum, Low Volatility, Quality & Growth) in the US. The factors are constructed as beta-neutral long-short portfolios by taking the top and bottom 10% of the stock universe in the US. The analysis covers the period from 2000 to 2017 and includes costs of 10 bps per transactions.
As of mid 2017 our universe of US stocks includes 1725 stocks with a minimum market cap of $1bn and a median market cap of $4bn. We divide this universe equally and as a result derive a small- and a large-cap universe. The median market cap of the small-cap universe is $2bn compared to $11bn for the large-cap universe.
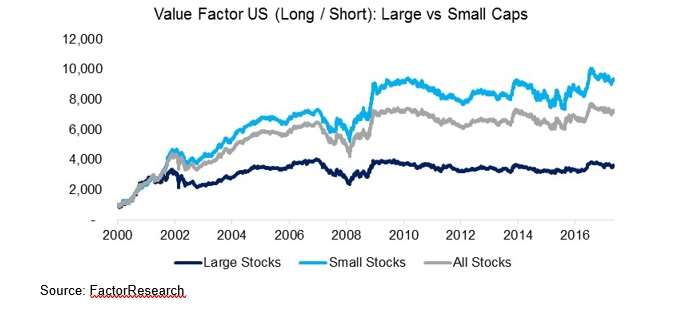
VALUE FACTOR US: SMALL VS LARGE CAPS
The chart below shows the performance of the Value factor in the US for all, small- and large-cap stocks. We can see that Value in general has been an attractive strategy in the small-cap universe while the returns in the large-cap universe have been much more muted. We can also observe that the factor performed strongly from 2000 to 2006; however, this is somewhat deceiving as prior to 2000 the factor experienced a significant drawdown in the Tech bubble when cheap stocks were strongly out of favour. Post the Global Financial Crisis in 2008 & 2009 the performance across all three stock universes has been essentially flat.
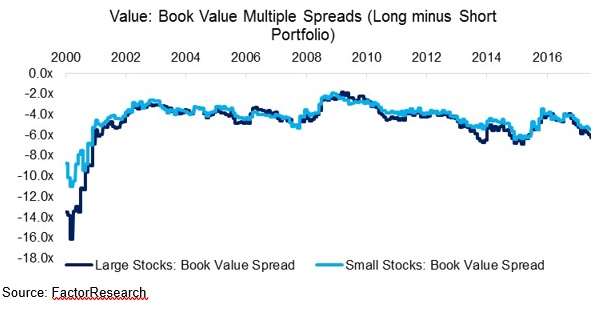
Investors might argue that there are more Value opportunities among smaller stocks, therefore making the small-cap universe more attractive for the strategy. The analysis below shows that the book value spreads, which are calculated by subtracting the average book value multiples of the short portfolio from the long portfolio, are almost identical in both universes. Given that there are equal opportunities from a valuation perspective in both universes, it’s somewhat perplexing that Value seems to consistently generate higher returns in the small-cap universe.
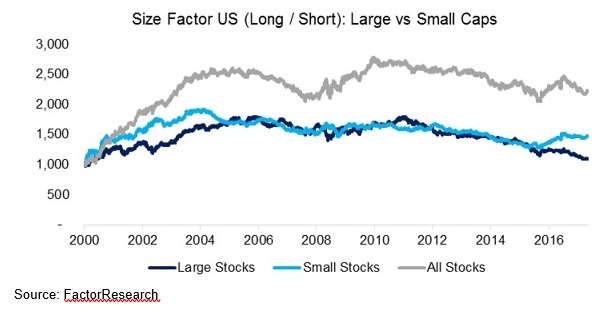
SIZE FACTOR US: SMALL VS LARGE CAPS
The next chart shows the Size factor, where we can observe that the performance across all stocks is much better than for the small- or large-cap universe. This is to be expected given that the stock selection ranking is based on taking long positions in small and short positions in large-cap stocks, which means the all stock universe offers the most extreme portfolios.
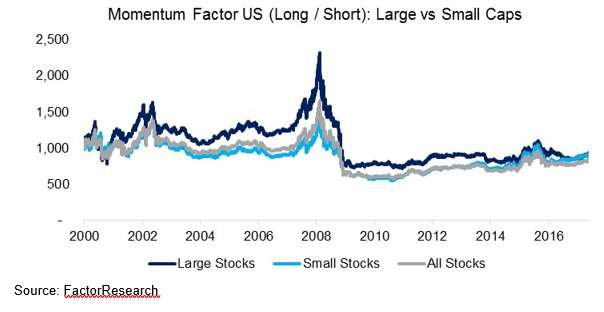
MOMENTUM FACTOR US: SMALL VS LARGE CAPS
In contrast to the Value and Size factor, there is no significant difference in performance between the small- and large-cap universe for the Momentum factor.
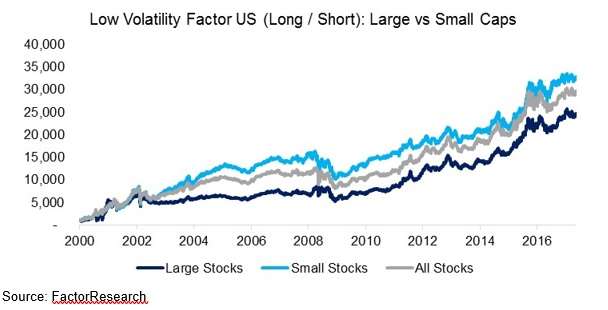
LOW VOLATILITY FACTOR US: SMALL VS LARGE CAPS
The chart below highlights that although the performance of the Low Volatility factor is better in the small-cap universe, the returns in the large-cap universe are still highly attractive. Low Volatility has shown the strongest performance of all factors in the period from 2000 to 2017.
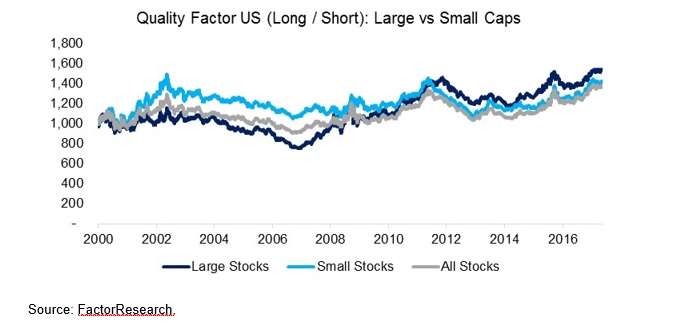
QUALITY FACTOR US: SMALL VS LARGE CAPS
The performance of the Quality factor has been relatively flat since 2000 and we can not observe a meaningful difference between the small- and large-cap universe.
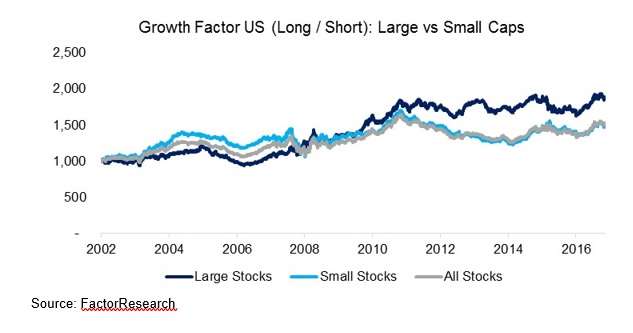
GROWTH FACTOR US: SMALL VS LARGE CAPS
Similar to Quality, there doesn’t seem to be a consistent better performance of either universe for the Growth factor. In the period 2002 to 2006 the Growth factor performance was stronger in the small-cap universe, thereafter performance was better in the large-cap universe.
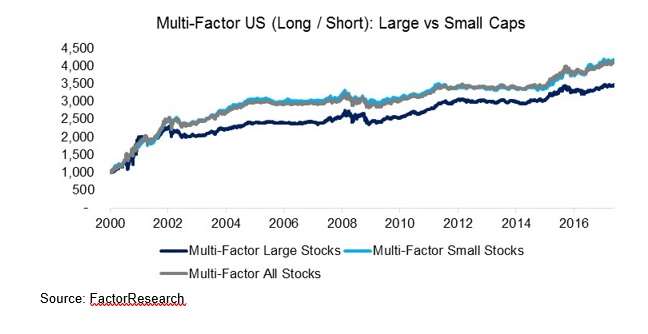
MULTI-FACTOR PORTFOLIO: SMALL VS LARGE CAPS
It’s also interesting to analyse the difference between small and large caps for a multi-factor portfolio. We combine all factors with equal allocations and rebalance annually. We can observe that the all- and small-cap stock are almost identical in terms of performance. The large cap multi-factor performance is lower, although the difference is derived from a short period in 2001 and does not appear consistent in nature. It’s worth pointing out the long periods of flat performance, which for an investor would have been emotionally difficult to experience.
FURTHER THOUGHTS
This short research note highlights the performance of factors across all stocks, small and large caps in the US. The frequent criticism that factor performance is stronger in small caps is not uniformly true for all factors, which can be considered positive results for institutional investors. Transaction costs might be modelled differently for the large- and small-cap universes, which would likely further level the playing field.