

European hedge fund managers continue to suffer from the uncertainties of the United Kingdom’s impending exit from the EU. The latest report from Eurekahedge says that European hedge funds have posted losses in eight of the first eleven months of 2018. They haven’t been in the positive numbers since July, and that was only a modest 0.44% gain. The Eurekahedge European Hedge Fund Index “is on track to post its worst yearly return since the peak of the Eurozone crisis in 2011.”
Brexit and Italy’s Budget Deficit Specifically, thus far the EEHFI’s 2018 return is -2.94%, a sharp contrast with the 2017 return of +7.15%. The bad 2018 numbers are not the fault of Brexit alone. Italy’s populist government spent November, insisting on pursuing a free spending budget plan, one that would have trebled the deficits that the previous government had projected, to the alarm of the nations to its north. Italy’s 10-year government bond yield rose to 3.8%, and the Italy-Germany 10 year bond spread reached its highest level since 2013. [In recent days, Rome seems to have backed away from its position on this issue, and it will accept some measure of austerity in order to remain in concord with the rest of the continent.] Among strategies, the macro funds have been especially hard hit by the news from Britain and from Italy. The Eurekahedge Macro Hedge Fund Index was down 0.56% in November, and the European mandate macro funds lost 2.63%.
A Lot of Red Ink Divided by region, the performance results and asset flows for November specifically look this way (with some rounding). 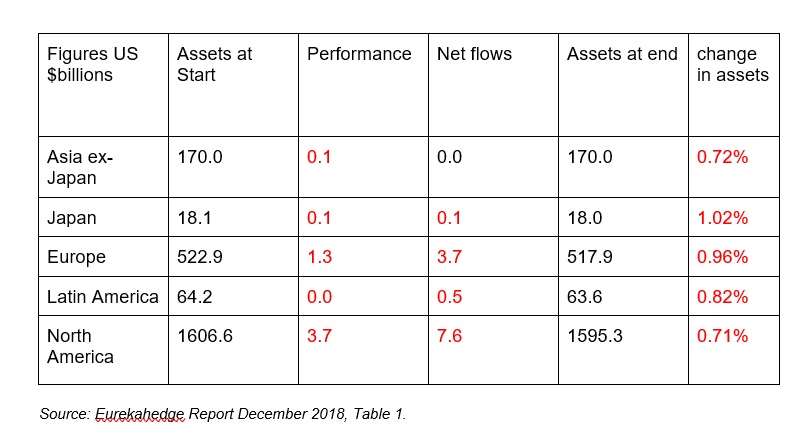 Remarkably, all the performance numbers are in the red, and the only regional mandate that escapes red ink in netflows rounds out to 0.0. Breaking down the YTD numbers by strategy, the best performing funds were distressed debt and relative value, which are in the black by $2.2 and $1.7 billion respectively. The stand-out on the negative side are the CTA/managed futures with red ink of $15.9 billion. The bad performance of the commodities part of the industry is attributable to the slump in oil prices specifically and in the energy sector more generally. Underlying equity markets moved upward in November, but hedge funds “struggled to position themselves to capture” that move, as Eurekahedge rather gently says. Less than a quarter of the hedge fund managers tracked by Eurekahedge managed to outperform the global equity market.
A Cease Fire in a Trade War Why did the underlying markets do well in November? In large part because the US Federal Reserve acted more dovish (slower to raise interest rates) than had been expected. Also in part because markets expected good things from the G20 meeting in Buenos Aires, which took place on November 30 and December 1. The meeting gave the political leadership of the People’s Republic of China and the United States the opportunity to discuss their differences and perhaps to dial back the ‘trade war’ between them. The markets’ anticipation that there would be some trade-related peace making proved accurate. The two Presidents agreed on a 90 day ceasefire on tariff-increasing measures, during which their respective experts would work together to address the structural issues affecting the trade imbalance. November 2018 was a good month to be short on volatility. Tail risk strategies were also positive for the month. Both long and relative value positions on vol were down. Year to date, though, all the vol strategies are down for 2018, with short vol down the most, followed by tail risk vol.
Prime Brokers The Eurekahedge report concludes with some brief observations about service providers. It observes, for example, that the HF prime brokerage industry is still dominated by the major US and European banks. The top three PBs based on assets under management are Morgan Stanley, Credit Suisse, and Goldman Sachs. Together those three account for almost half of the total AUM of the industry. Further, the concentration of the market for PB services has increased in recent years. In 2008 the top 10 PBs services roughly 68% of AUM, leaving 32% for non-league-table entities. In 2018, though, the top ten reached 89% of AUM, leaving just 11% for other entities.