


By Nicolas Rabener of FactorResearch (@FactorResearch)
Beta is like ice cream and comes in many flavors. Broadly we can categorize it into the following four types:
- Plain beta: Market capitalization-weighted benchmark indices like the S&P 500 or FTSE 100.
- Smart beta: Indices with tilts to factors backed by academic and practitioner research. The most established factors in equities are Value, Size, Momentum, Low Volatility, and Quality.
- Stupid beta: The inverse of smart beta. For example, if Growth is defined as selecting the most expensive stocks, then this does not constitute a particularly clever strategy given that it goes against decades of research.
- Different beta: All other indices, e.g. stocks chosen on Catholic values. The excess returns of these indices are likely zero before costs and negative after costs on average, but such styles tend to align with personal values.
Equal-weight or fundamentally weighted indices can be attributed to smart, stupid, or different beta, depending on the index construction.
Most investors are likely fully served by simply allocating to plain beta ETFs, but if achieving outperformance is a requirement, then smart beta is the only choice that has a solid foundation.
However, smart beta ETFs are more expensive than plain beta ETFs and it is questionable if factor exposures are sufficient enough to offset the higher fees.
In this short research note, we introduce a framework for evaluating smart beta ETFs and use value-focused products in the US as a case study.
SMART BETA FEES & FACTOR EXPOSURES
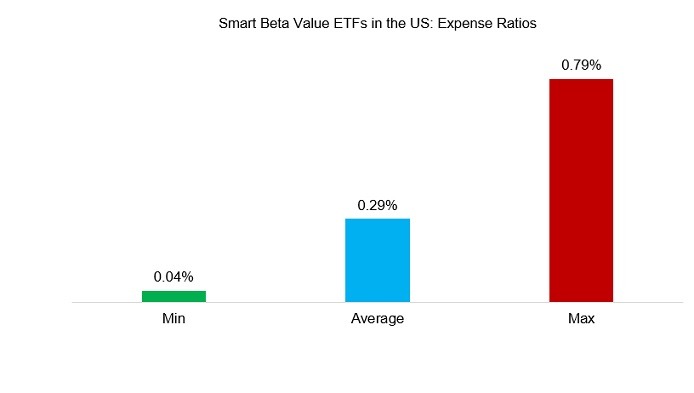
We define all value-focused ETFs in the US as our universe and select these primarily based on the product featuring “value” in its name. We exclude all ETFs that include other factors as we are only interested in pure value strategies, which results in a universe of 43 ETFs with a combined market capitalization of $210 billion.
First, we compare the expense ratios and observe that the average expense ratio is 0.29% with the cheapest ETF charging 0.04% and the most expensive 0.79% per annum. An investor that has exposure to the latter should have excellent reasons for why the high fees are justified as these will affect performance significantly over time.
Source: ETF.com, FactorResearch
An investor considering value-focused ETFs is likely to base his investment decision on factor investing literature, which highlights positive excess returns from the factor over the medium- to long-term in equities and other asset classes.
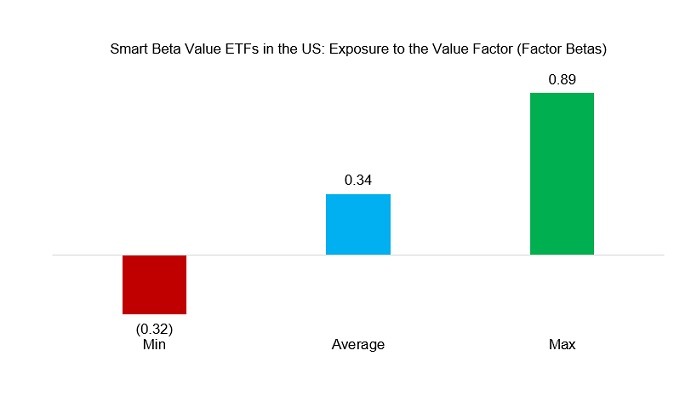
We define value by a combination of price-to-book and price-to-earnings multiples, which is in line with academic research. Next, we measure the factor exposure of the smart beta ETFs via a regression analysis using daily data. We observe that the exposure was positive to the value factor on average, however, that the exposure varies substantially amongst the ETFs.
Most ETF issuers define the value factor relatively homogeneously by selecting stocks on price-to-book, price-to-earnings, cash flow metrics, or a combination of these. Although some providers offer more differentiated factor definitions, these should not lead to extremely low or negative exposures.
The ETF that exhibits negative factor exposure indicates a stock selection process that does not pick cheap stocks, which is misleading for investors given that we exclusively selected ETFs with “value” and no other factor references in the product name.
Source: FactorResearch
FACTOR SCORE FOR SMART BETA ETFS
This analysis highlights a range of fees and factor exposures for value-focused ETFs in the US. Simply selecting the cheapest ETF is not advisable as the costs need to be seen in relation to the factor exposure. A cheap ETF that provides almost zero factor exposure can be less attractive than an expensive one with a high factor exposure.
Therefore, we create a factor score, which is calculated by dividing the factor beta by the expense ratio. The factor score is not useful as an absolute number, but highly informative on a relative basis. The average factor score of the 43 value-focused ETFs is 1.7 and all products that score below that are more expensive per unit of factor exposure. The higher the factor score, the better the value-for-money proposition.
It is worth noting that a low factor score might be explained by a significantly different value definition, but it can also reflect fees that are too high on a relative basis. Given this, factor scores should be seen as one of the primary metrics for comparing smart beta ETFs.

Source: FactorResearch
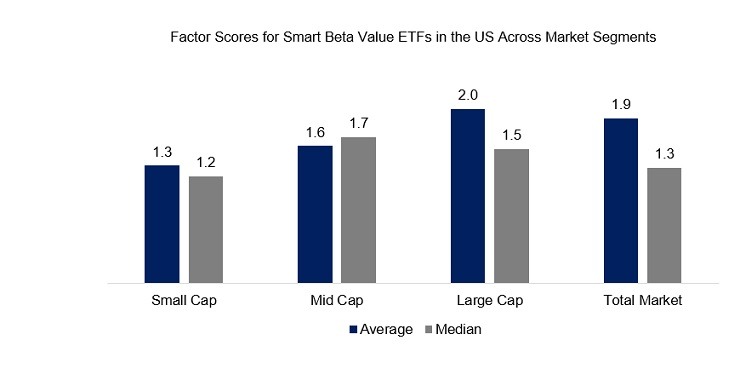
We considered all value-focused ETFs across market segments when defining our universe and an investor might argue that an ETF focused on small-cap stocks should not be compared to one that targets large-cap stocks. However, we can contrast the average and median factor scores across the market segments, which highlights that these are approximately similar.
Source: FactorResearch
Finally, we compare the factor scores and betas aggregated by ETF issuers, which provides an interesting perspective. The following observations:
- The highest factor scores are achieved by large asset management firms like Charles Schwab, State Street, and JP Morgan, which is not explained by higher factor betas, but simply by very low fees.
- Somewhat surprisingly, the suite of ETFs from BlackRock and Vanguard, which dominate the ETF industry, offer only average factor scores.
- Smaller asset management firms tend to provide lower factor scores, but high factor betas, which implies that their fees are not competitive.

Source: FactorResearch
FURTHER THOUGHTS
Investors seeking exposure to the value factor via smart beta ETFs can use factor scores to maximize the factor exposure per dollar in fees. Unfortunately, this framework does penalize the smaller asset management firms, which often feature more innovative strategies and higher factor exposures, but need to charge higher fees to make ETFs economically viable.