


By Christoph Junge, CAIA, Head of Alternative Investments at Velliv Pension & Livsforsikring A/S; Denmark’s third-largest commercial pension company.
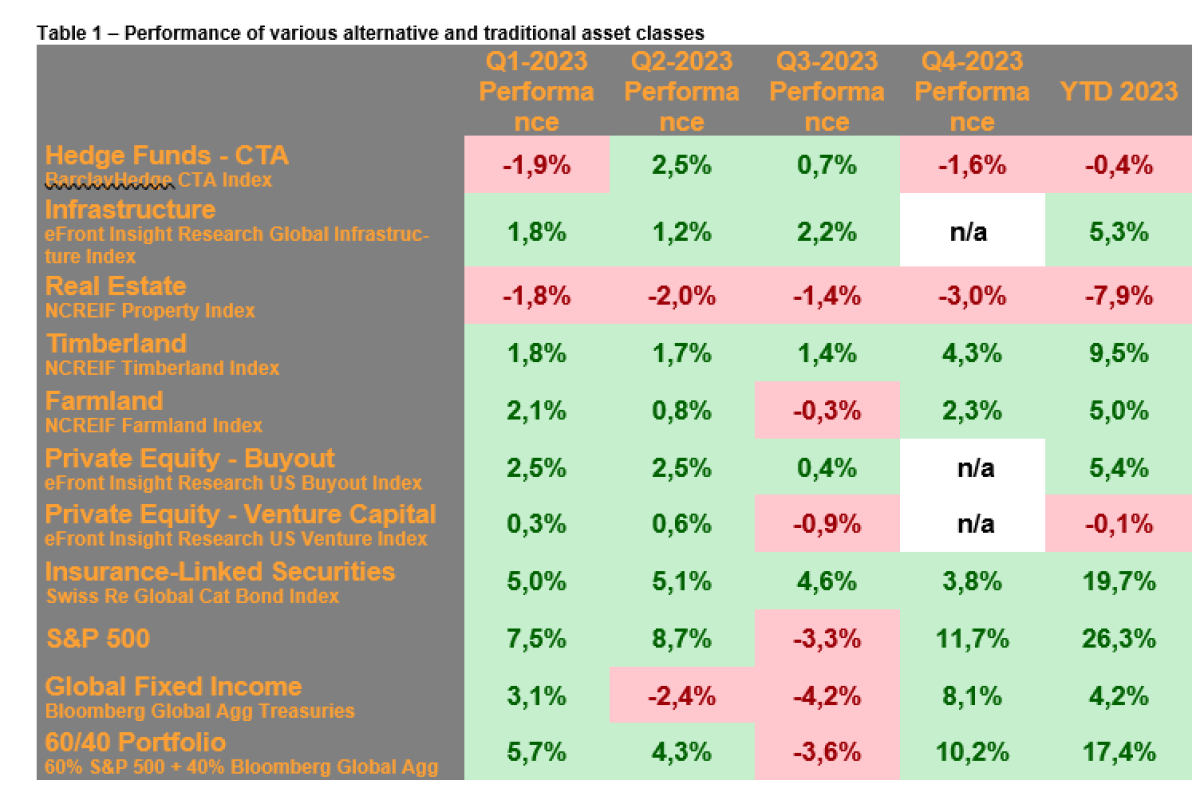
The year 2023 ended with a true firework on the financial markets with both equities and fixed income going through the roof. A widely used benchmark for a balanced portfolio consisting of 60 pct. equities and 40 pct. bonds, earned 10,2% during the fourth quarter alone, leading to a total gain of 17,4% for the year as a whole, which is more than many expected as the consensus going into 2023 was a recession hitting the markets soon.
In the alternative’s universe, the year 2023 was the year of the niche strategies. While “mainstream alternatives” like private equity and real estate, that most institutional investors have sizable allocations to, had a hard time and delivered lackluster returns at best, niche strategies like ILS and forestry delivered outstanding returns. Sometimes money does indeed grow on trees.
New benchmarks in this column
As mentioned before, I have been looking for new benchmarks for infrastructure and private equity and can finally present a suitable replacement. I have chosen to use the eFront Insight database for infrastructure, private equity buyout, and venture capital. These indices consist of unlisted funds and are thus more representative for the results achieved by institutional investors. The disadvantage, however, is that these indices come with a lag, meaning that at this point in time only the Q3 2023 results are available.
But before we dig into the numbers, I want to remind you of a few technical facts of importance.
Most alternative investments, aside from liquid alternatives, are long-term investments. To evaluate the performance over a single quarter has limited explanatory power.
There is always a time lag between reported returns and public market returns due to the illiquid nature of the underlying investments.
Alternative investments are very heterogeneous with huge dispersion also on the manager level. The realized returns of an investor will most likely deviate from the benchmark-level returns.
Bloomberg & eFront Insight Research benchmarking
CTA, a sub-asset class from the hedge fund universe that is known for using trend-following models, suffered from the turnaround of both equities and fixed income following the softer CPI print in November and ended the year slightly negative. 2023 was not an easy year for trend followers with two major moves. The first one was the regional banking crisis in the US in March and the second one being the equity and fixed income rally fuelled by the inflation surprise in Q4.
According to this research note from AlphaSimplex, excluding the two worst days happening in March 2023, the performance of the SG Trend Index would have been close to 10%-points (!) better.
Slower strategies performed generally better than faster strategies during 2023, with March and December being the exception to this rule as the faster models adapted quicker to the changing markets. Besides these two periods, the faster models got whipsawed and suffered more.
Another factor explaining performance differences is the contracts traded, where some underlying assets performed better than others. Positive performance can be attributed to exposure to soft commodities like cocoa and sugar and emerging market currencies like MXN and BRL. Strategies that did not have exposure to these assets missed some great opportunities. Typical mainstream contracts like WTI Oil and various fixed-income contracts were for many strategies not profitable.
It remains to be seen whether 2024 will be a good year for CTA or not, but as of the time of writing these lines, the market is off to a pretty good start. CTA do at least have some tailwinds from the higher base rates on the collateral.
Infrastructure, as represented by the eFront Insight Research index, an index consisting of unlisted funds, showed resilience during the first three quarters of the year with an accumulated return of 5,3%. As the time of writing this column, the data for the fourth quarter was not published yet. The third quarter return was not impacted by the free fall of the stock price of the renewable energy darling Ørsted (-40% in Q3 2023) after the company announced impairments due to challenging market conditions. This relates to development projects of offshore wind parks that are negatively impacted by both supply-chain issues, increased interest rates as well as lack of favourable progress in Investment Tax Credit (ITC) guidance.
This highlights once again, that it is important to take a nuanced view on the infrastructure asset class as for example transportation assets have been performing quite well.
Real Estate, as represented by the NCREIF Property Index, an unlevered index of directly held properties in the US, continued downwards and ended the quarter with a loss of 3,02%, bringing the full year return down to -7,94%. Office, making up 23% of the index, was the main culprit with a loss of -17,63% for the year. Hotels were the only sub asset class with a positive return of 10,31% for the year.
MSCI Real Assets reported, that global deal activity in 2023 fell by almost 50% relative to 2022, which is the lowest level in a decade. According to the MSCI report, for deal activity to recover, buyers and sellers would need to become more aligned on pricing amid the higher-rate environment.
Timberland ended the year with strong performance and posted positive returns of 4,3% in the fourth quarter, bringing the full year return to 9,5%. But before we get too excited about the strong fourth quarter: it is a known seasonality in the timberland index as most assets are being appraised by third-party appraisers in the fourth quarter. But still, this is a very impressive performance, leading me to write that money apparently does grow on trees.
Also farmland ended the year on a strong note with a quarterly return of 2,3%, bringing the full year return to 5,0%. Most of the year-to-date performance was driven by annual croplands, while permanent croplands (fruit plantations etc.) did less well.
Private Equity was a tale of two markets with Buyouts up and Venture Capital down both during Q3 2023 and year to date. At the time of writing this column the numbers for Q4 2023 are unfortunately not out yet due to the illiquid nature but my expectation is somewhat the same for Q4 with buyout outperforming venture.
While things still are not rosy in private equity land there were some green shoots as Pitchbook data showed an increase in exits in US PE during Q4 2023. But activity is still substantially down compared to the post-Covid era, which also extends the average holding period of portfolio companies. According to PitchBook, the median age for PE portfolio companies in the US was 4.2 years in 2023, an 11-year high, while the median age for exited companies last year was an all-time high of 6.4 years. It remains to be seen whether the green shoots from Q4 2023 are bellwether of a better exit environment in 2024.
The higher interest rates are often named as one of the main culprits for the slowdown in deal activity. Another impact of higher interest rates might be, that PE funds are using more equity and less debt nowadays. This has, however, been a trend for many years. As can be seen in figure 1 below, the average LBO equity contribution has increased from less than 30% in 1997 to more than 50% in 2023. At the same time, the equity share of total enterprise value of companies in the Russel 2000 Value index (calculated as 1 – Total Debt to EV) has decreased from close to 60% in 1997 to app. 45% in 2023. It seems like the old saying by PE critics that PE is just levered small cap value stocks needs to get updated. If this trend continues, one might start calling small cap value stocks for levered PE.
This back-on-the-envelope calculation is of course not highly scientific and differences in sector composition can play a role. On the other side, the typical buyout is levered the most at the very beginning (which is what is shown here), and de-levers over time while the leverage in listed companies does not follow this pattern.
Figure 1: Private Equity is levering down, public markets are levering up
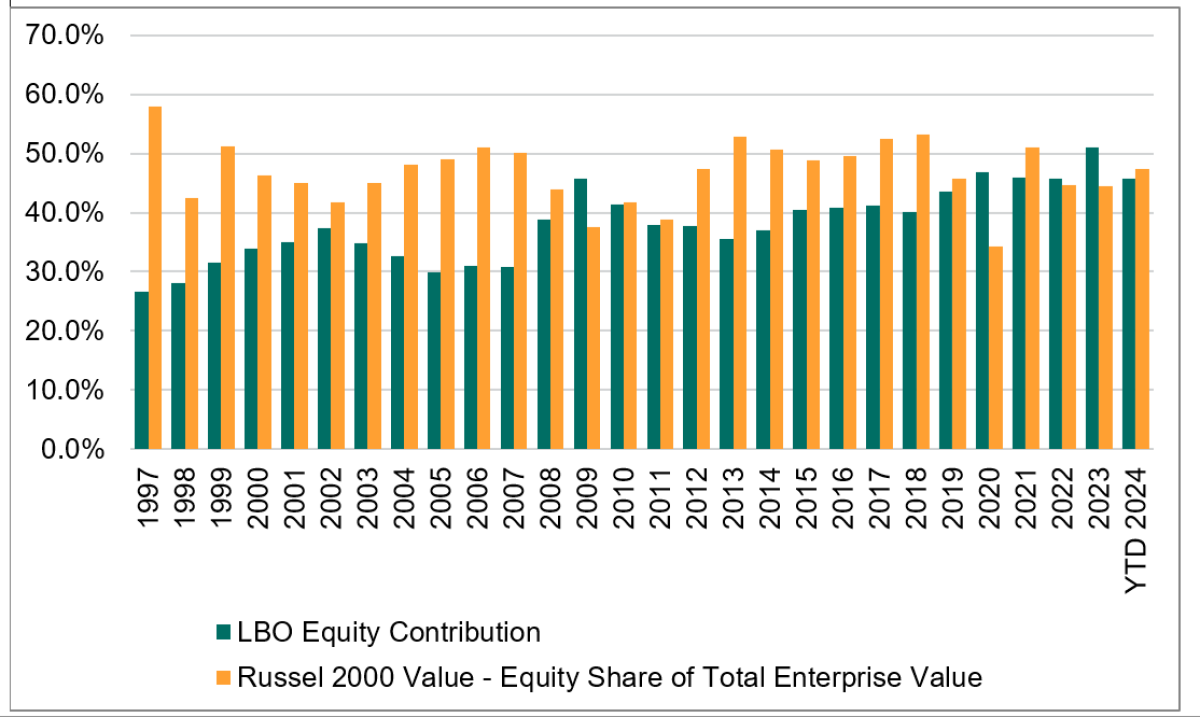
Source: PitchBook Data, Inc. & Bloomberg
The increase in equity contribution also places greater demands on the GPs as financial engineering no longer is enough to generate value. Those GPs who have specialized in their field and are masters of operational excellence will still be able to create value to their investors.
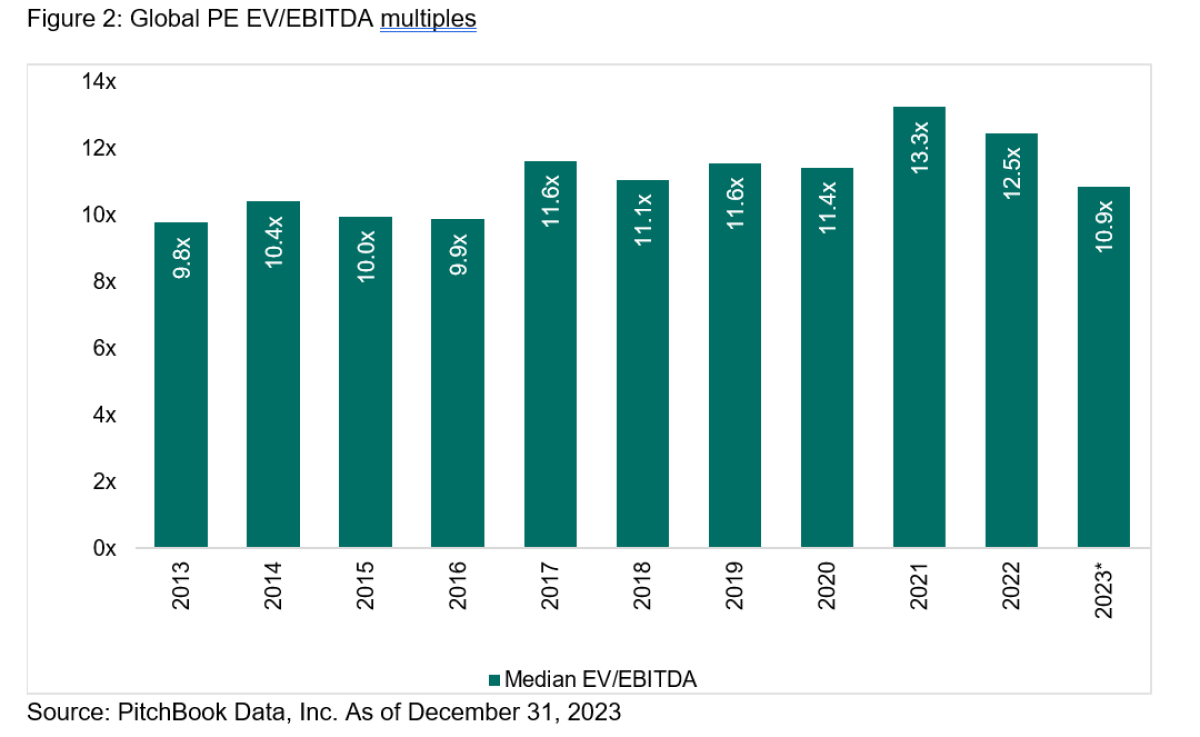
The median EV/EBITDA multiple in buyout deals has decreased a bit, but not substantially, as shown in figure 2 below. This is good for existing investors in PE but might also indicate, that these years will not be stellar vintages for new investors. But as highlighted in my last column, it is important to continuously make commitments as trying to time is futile.
Insurance-Linked Securities (ILS), often also referred to as “CAT Bonds” (catastrophe bonds), continued its strong performance and posted a gain of 3,8% for the Swiss Re Global CAT Bonds Index, bringing the total return for the full year to 19,7% - the strongest performance among the alternative asset classes covered in this column and the strongest year since the inception of the index, dwarfing the earlier record from 2007 where the index delivered 14,97%. The extraordinarily strong performance was driven by both higher spreads (e.g., insurance premium), higher rates on the collateral and a rebound of some CAT bonds that traded down in the aftermath of Hurricane Ian in late 2022 that were not as affected as initially thought – and of course no major catastrophe.
Even though spreads are coming down, market participants still say that “cat bonds remain a compelling asset class to include in a fixed income portfolio allocation. And not just for return optimization, but also risk diversification, given the low qualitative and quantitative correlation of cat bonds to most other traditional asset classes as well as little interest rate duration risk.”
Unless a major catastrophe occurs, ILS could be off for another very positive year – albeit not as positive as 2023 - as they are also profiting from the higher base rates.
Conclusion:
There was high dispersion in the performance of alternative investments during 2023 with niche asset classes like ILS and timberland being the top performers. But also other real assets, namely infrastructure and farmland, fared quite well, with real estate being the odd one out with painful losses.
CTA, being famous for delivering crisis alpha, posted a small loss, mainly driven by a few trading days with some sharp reversals in interest rates following the banking crisis in March 2023 and again in Q4 2023 following the softer CPI print in November.
Private equity has been a tale of two markets this year, with buyout delivering at least positive but not impressive returns and outperforming venture but lagging listed equities by a large margin. With that being said, this comes after a healthy outperformance in 2022.
As most institutional investors have their largest allocation to real estate and private equity and less (or none) to timber and ILS, the performance contribution to the overall returns was most likely more muted in 2023. But still important to highlight the dispersion on manager level, which can lead to substantially different outcomes than the benchmark returns.
Looking at the crystal ball for 2024, I am a cautious optimist. But the development in 2024 is fraught with great uncertainty and the year may turn out to be a volatile year, characterized by low growth. High interest rates, tighter credit conditions and increased cyclical and geopolitical risks incl. deglobalization can put markets under pressure. If the US and Europe should end up in a recession (which is absolutely not certain), earnings in many portfolio companies will fall, which will affect the valuation of private equity portfolio companies. In this scenario, parts of the core infrastructure universe, especially contracted and regulated assets, might be able to deliver positive returns, while the more cyclically sensitive assets, such as airports and ports, will likely be hit by falling volumes. CTA / managed futures have the potential to provide positive returns, as long as there are clear and persistent trends within shares, commodities, currencies and interest rates. They profit also from the higher base rates.
This column was first published on AMWatch.
About the Author:
Christoph Junge, CAIA is Head of Alternative Investments at Velliv; Denmark’s third-largest commercial pension company. He is a Chartered Alternative Investment Analyst and has more than 20 years of experience from the financial industry in both Denmark and Germany. He has worked with Asset Allocation, Manager Selection as well as investment advice in, among others, Nordea, Tryg and Jyske Bank.

Besides working as a Head of Alternatives, Christoph teaches a top-rated course on Alternative Investments. Read more at http://www.christoph-junge.de | Twitter: @InvestmentJunge
Disclaimer
This publication is provided for informational purposes only and such information is not intended to be relied upon as a forecast, research or investment advice. All data is provided for informational purposes only and is not intended to be relied upon as investment, trading, accounting, financial or other advice, recommendations or decisions. The data is not provided as “Input Data” for the purposes of Regulation 2016/1011 of the European Parliament and of the Council (as amended or superseded from time to time) and may not be used as “Input Data”. You may not use or cause or permit others to use or consider any data in connection with an offer to sell, or solicitation of an offer to buy, any security. Velliv, Pension & Livsforsikring A/S makes no guarantee, representation or warranty and accepts no responsibility or liability as to the accuracy and completeness of the publication, nor for any trading decisions, damages or other losses resulting from, or related to, the information, data, analysis or opinions or their use. Any opinions contained in the publication are those of the Author at the time of the publication. Investment markets and conditions can change rapidly and as such the opinions shall not be taken as a statement of fact. Neither the information nor any opinion expressed herein constitutes a recommendation, offer or solicitation to buy or sell any securities or to adopt any investment strategy. Such information and opinions are subject to change without notice. Past performance is no guarantee of future results.