


By Stephen L. Nesbitt – Chief Executive Officer, Chief Investment Officer of Cliffwater.
Vintage year1 has played an important role in the traditional playbook for private asset investing. This is a mistake, both when allocators target specific vintages opportunistically and when they purposefully parse commitments across multiple vintages in the name of diversification. The focus on vintage lowers return, and does little to reduce risk, perhaps even increasing it under some conditions. The failure of vintage year management in traditional allocation models is acute for private debt, where vintage years have little differentiation and opportunity costs for unfunded commitments are high and immediate. Investors are better served by newer portfolio solutions2 that attach less importance to vintage and, instead, get and keep capital invested in an expedited and diversified fashion.
First, the easy lift.
Market timing doesn’t work!
True for stocks, interest rates, and predicting recessions. No firm in the last 50 years has successfully used market timing as an investment strategy. That won’t change.
Vintage timing doesn’t work either. Some allocators to private debt are avoiding recent loan vintages, theorizing that unexpected 2022-23 rate hikes have put EBITDA pressure on corporate borrowers of recent vintages, lowering equity returns and increasing potential defaults. Instead, they conclude, capital should be directed to newly minted vintage funds whose loans are underwritten to a “higher for longer” interest scenario.
This specific trade won’t work either:
• Vintage timing ignores markdowns in loan prices for adversely impacted loan vintages, offsetting potential default losses. Cliffwater loan data shows that past private debt markdowns more than offset future realized losses from defaults, suggesting that investors might get a better deal investing new monies in prior vintage loans after price adjustments compared to new vintages priced at par.3
• Loan amendments/restructurings/covenant protections on challenged legacy vintages generate additional fees and spread income, offsetting risk of principal loss.
• Specific vintages can’t be targeted. New funds generally invest over three years (vintages), leaving investors to drive blind in years two and three.
• Vintage timing reduces return. Cambridge Associates private fund return data shows that “opportunistic credit strategies,” which would include vintage timing, meaningfully underperform overall credit strategy returns over both the last 10- and 20-years ending September 30, 2023. The return shortfall in opportunistic credit is also present when measured against the Cliffwater Direct Lending Index or Cliffwater’s private fund database.
Most experienced allocators to private assets understand that vintage timing doesn’t work4, but still target consistent allocations across vintages to reduce portfolio risk, like a dollar-cost-averaging approach to public stock investing. This is called vintage diversification.
Yet even this old-school, conservative thinking can be challenged.
Vintage diversification dilutes performance by a lot!
Achieving vintage diversification in the old-school way requires leaving significant assets on the sideline waiting for years to be called by private funds for investment. This asset parking is very costly as demonstrated in Exhibits 1.a and 1.b. Exhibit 1.a depicts the typical investment (aka drawdown) progression for a single private direct lending fund, relying upon Preqin 2013-2022 vintage data.5
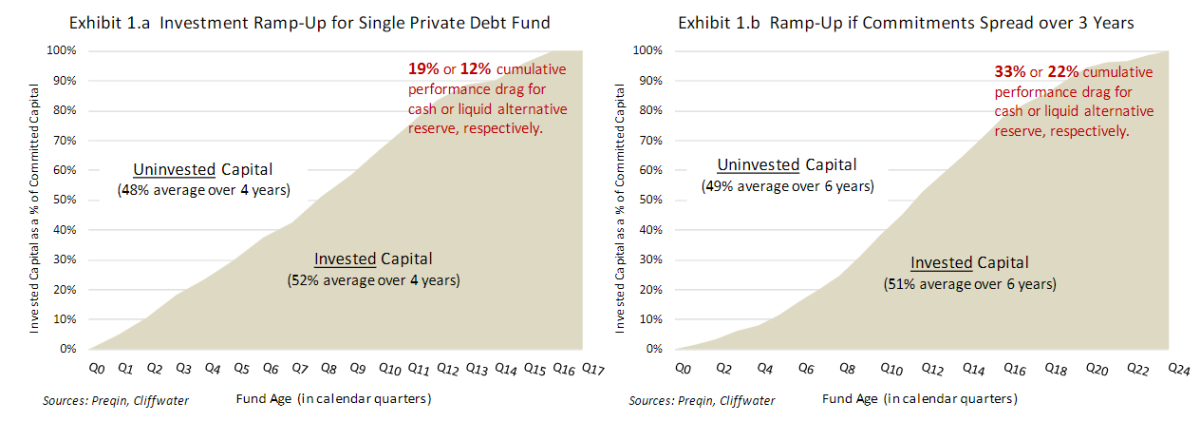
Exhibit 1.a shows that it takes 16 quarters (four years) for a private fund to get fully invested with an average invested amount equal to 52% of the intended amount. That leaves an average of 48% uninvested over the four-year period. That uninvested capital will generally be invested in cash or a close liquid alternative, such as traded bank loans (aka leveraged loans), until called by the private fund. Deploying uninvested amounts in cash or bank loans will reduce returns by 8% and 5% per year, respectively, based on Cliffwater’s expected returns.6 As a result, private fund vintage diversification as depicted in Exhibit 1.a will produce a cumulative
opportunity cost in lost return equal to 19% or 12% when cash or bank loans, respectively, are deployed for uninvested capital.
A 12-19% opportunity cost seems a high price to pay for vintage diversification within one private fund. It gets worse.
Cash drag from unfunded commitments is compounded by allocator “commitment pacing models” that stretch fund commitments over at least three years. Not only is the private fund deferring investment, but the allocator is deferring fund commitments, also in the name of vintage diversification. This double deferral is depicted in Exhibit 1.b. Allocator commitment pacing over three years extends getting invested another two years, increasing the opportunity costs to 33% or 22% when cash or bank loans, respectively, are deployed for uninvested capital.
Is vintage diversification worth sacrificing 22-33% in return? Hell no!
The benefit from vintage diversification is to avoid a large deployment of capital at market peaks, and, instead, spreading capital across a range of market conditions and accepting average-like vintage year outcomes. Simply, don’t put all your eggs in one (vintage) basket.
Fortunately, the benefit of vintage diversification is measurable, using the standard deviation of historical vintage year returns. Higher values should be expected for private equity, lower values for private debt. Using the Cambridge Associates private fund database, the standard deviation of 1986-2014 vintage year cumulative returns equals 25% and 13% for US buyouts and US private credit, respectively.7
Combining the expected opportunity losses in Exhibit 1.b with historical vintage risk, which includes the Financial Crisis, answers whether vintage diversification is worthwhile.
• For the investor reserving uncommitted capital in cash, a -33% opportunity cost is paid for the avoidance of 13% in vintage risk. The ratio of cost-to-risk, -2.5, is akin to a t-statistic. Its high absolute value suggests high statistical significance and the negative value means that investors should never trade vintage diversification for cash holdings. Better to invest everything in one vintage year!
• For the investor reserving uncommitted capital in a public equivalent asset like bank loans, a -22% opportunity cost is paid for the avoidance of 13% in vintage risk. The ratio of cost-to-risk equals -1.7, a value that would cause most all investors to shun vintage diversification.
• However, the public equivalent example is not complete. Investors using this approach to vintage diversification have the public market equivalent return as their performance benchmark. Therefore, their measure of risk is not the 13% vintage risk, but, instead, vintage risk defined as the difference between vintage fund returns and same period bank loan returns.8 Data availability limits our ability to exactly quantify what is commonly referred to as “basis risk” which in this case combines vintage and public market equivalent risk. It can be estimated knowing the 10-year standard deviation of bank loans, 30%, and their correlation to private debt 0.79. In our example, 13% vintage risk is replaced by a 10% cumulative basis risk which the investor is avoiding. The ratio of cost-to-risk equals -2.2, which is statistically significant, again strongly directing the investor not to give up return for vintage diversification.
Vintage diversification doesn’t exist in public-to-private reallocations.
Most investors today are trading public equity for private equity or public debt for private debt. In those exchanges vintage diversification doesn’t exist. Vintage performance for public equity will track vintage performance for private equity. They are deeply correlated. The same is true for public debt and private debt.9 A good (bad) private vintage year is a good (bad) public vintage year. When practicing vintage diversification, institutions generally like holding private asset uncommitted capital in the public-market- equivalent (PME) asset class. Vintage diversification is a waste of time, energy, and money in these examples. In fact, the lower historic volatility of private assets compared to equivalent public assets, combined with their high correlation, strongly points to accelerating, not deferring, allocations from public to private alternatives.
For investors reallocating from debt to equity, or vice versa, vintage diversification may matter, but it will matter a lot more going from debt to equity than equity to debt. That is because vintage diversification matters most where disparate risk levels exist and correlations are low. That would be true going from public debt to private equity compared to public equity to private debt. The variability across private equity vintage returns, measured over a 10-year period, is approximately 2x higher when compared to private debt vintage returns. In addition, the correlation between public debt and private equity measures -0.1 historically.10 The case for vintage diversification is weakest for investors reallocating from public equity to private debt where differences in expected annual returns favor private debt by 2%, differences in risk are high, also favoring private debt, and correlation is high.11
Implementation of vintage diversification is a challenge.
If vintage diversification is achieved by investing similar amounts in private investments over time, it seldom works. While allocator commitment pacing models look good in presentation materials, market volatility forces allocators to constantly redo their models to decrease (increase) commitments when markets fall (climb) in a fashion contrary to dollar-cost-averaging. In hindsight, 10-year actual private asset vintage allocations end up looking very different from the models, and often not in a good way. Take 2022-23, for example, when stocks fell and private debt deal activity dried up. Both demand and supply conditions depressed investment below what most allocators modeled, in what will likely be good vintage years.
To make matters worse, unexpected cash distributions from private funds after the investment period further complicates vintage management by requiring investors to repeat the same unfunded commitment cycle. Old-school thinking requires allocators to manage commitments to vintage years, even after ramp-up, rather than actual invested dollars.
The ubiquitous internal-rate-of-return (IRR) in private asset performance obfuscates the cost of vintage diversification.
In “You Can’t Eat IRR,”12 Howard Marks perfectly captured the voodoo that the IRR calculation bestows upon private funds—by omitting the performance drag from uncalled capital in the calculation of return. Is it any wonder why managers only disclose private fund IRR when reporting performance?13
Ok, if not vintage diversification, what?
If vintage diversification doesn’t matter and instead the answer is to get invested and stay invested, how can that “New-School” philosophy be implemented? The solution may be found in the growth of perpetual/evergreen structures that immediately provide investors exposure to private assets and keep them invested. A different set of concerns, such as valuation and liquidity, come with perpetual funds but potential benefits have proven to be significant, particularly for investors wanting convenient access to private assets.
A final thought.
Manager selection matters in private assets. Experienced private asset allocators know, and the data supports14, that picking the right manager is far more important than anything having to do with vintage. And the good news is that picking the right manager is achievable. Allocators need to ignore the vintage voodoo that usually does more harm than good, and, instead, search out private asset vehicles that will keep their capital invested with top-tier managers.
Footnotes:
1 Vintage, in the context of investing, refers to the calendar year an investment is made.
2 Often called “perpetual” or “evergreen” funds, these include fund vehicles with no conclusion but various investor options for
intermittent liquidity.
3 “2023 Q3 Report on US Direct Lending”, page 5, Exhibit 10, found at http://www.CliffwaterDirectLendingIndex.com.
4 Though some think (wrongly) that doesn’t apply to distressed debt.
5 Cliffwater proprietary private fund database shows very similar results.
6 Cliffwater 10-year expected returns on September 30, 2023, were 10.85%, 5.85%, and 2.85% for direct lending, bank loans, and
cash, respectively.
7 Standard deviations are for 10-year horizon cumulative return, the typical private fund life.
8 Cash is assumed to be riskless so only the 13% vintage risk is considered.
9 The correlation between state fund private equity returns and the public equivalent Russell 3000 Index equals 0.80 for the period
June 2000 to June 2022. An identical correlation is found using the Cambridge Private Equity time series as a proxy for private equity
returns. The correlation between private debt, measured by the Cliffwater Direct Lending Index, and the public equivalent Morningstar LSTA US Leveraged Loan Index equals 0.79 for the period September 2004 to June 2023.
10 Annual standard deviations for the period September 2004 to June 2023 are 4% and 11%, respectively, for public debt (Bloomberg Aggregate Bond Index) and private equity (Cambridge Private Equity Index). Correlation measured -0.01.
11 Annual standard deviations for the period September 2004 to June 2023 are 17% and 4%, respectively, for public equity (Russell
3000 Index) and private debt (Cliffwater Direct Lending Index). Correlation measured 0.69.
12 July 12, 2006, Oaktree Capital.
13 Additionally, the IRR calculation is appropriate only when the fund manager has absolute control over cash flows. That may be
true for private equity managers, but for private debt fund, cash flows are co-dependent upon decisions made by the private equity
sponsor and not the private debt manager.
14 Cambridge data shows for most private assets that the cross-sectional standard deviation of individual manager performance
within vintages far exceeds the standard deviation of vintage year returns.
About the Author:
Steve Nesbitt is Chief Executive Officer and Chief Investment Officer of Cliffwater, and is primarily responsible for the day-to-day management of Cliffwater Corporate Lending Fund (CCLFX) and the Cliffwater Enhanced Lending Fund (CELFX), an SEC registered credit interval fund focused on the US corporate middle market.

Steve is recognized for a broad range of investment research. His papers have appeared in the Financial Analysts Journal, The Journal of Portfolio Management, The Journal of Applied Corporate Finance, and The Journal of Alternative Investments. His private debt research led to the creation of the Cliffwater BDC Index, measuring historical BDC performance, and the Cliffwater Direct Lending Index, measuring historical performance for direct middle market loans. Steve authored the book, Private Debt: Opportunities in Corporate Direct Lending, Wiley Finance (2019) which provides the analytical and empirical underpinnings of the private debt market.
Stephen L. Nesbitt snesbitt@cliffwater.com
The views expressed herein are the views of Cliffwater LLC (“Cliffwater”) only through the date of this report and are subject to change based on market or other conditions. All information has been obtained from sources believed to be reliable, but its accuracy is not guaranteed. Cliffwater has not conducted an independent verification of the information. The information herein may include inaccuracies or typographical errors. Due to various factors, including the inherent possibility of human or mechanical error, the accuracy, completeness, timeliness and correct sequencing of such information and the results obtained from its use are not guaranteed by Cliffwater. No representation, warranty, or undertaking, express or implied, is given as to the accuracy or completeness of the information or opinions contained in this report. This report is not an advertisement, is being distributed for informational purposes only and should not be considered investment advice, nor shall it be construed as an offer or solicitation of an offer for the purchase or sale of any security. The information we provide does not take into account any investor’s particular investment objectives, strategies, tax status or investment horizon. Cliffwater shall not be responsible for investment decisions, damages, or other losses resulting from the use of the information. Past performance does not guarantee future performance. Future returns are not guaranteed, and a loss of principal may occur. Statements that are nonfactual in nature, including opinions, projections, and estimates, assume certain economic conditions and industry developments and constitute only current opinions that are subject to change without notice. Cliffwater is a service mark of Cliffwater LLC.