

 PrevInvest, in its May 2013 Investment Themes, provides a discussion of why long/short equity, also known as “equity hedged,” has experienced poor performance against market benchmarks over the last half decade. This is something of a flagship for the industry. It is the strategy that gave “hedge funds” their name, after all: it is the strategy of A.W. Jones!
PrevInvest’s discussion of the numbers leads it into important related matters: the statistical relationship between fund size and performance, for example, and the variable value of a fundamental approach to investing.
Long/Short Equity Doldrums
To begin: a look at Figure 1 from the PrevInvest report shows the doldrums in which long/short is stuck. The green line, representing the S&P 500 total return index, records a 94.32% return for the period from the end of 2008 through April 2013.
The Dow Jones Credit Suisse Long/Short Equity Index for that same post-crisis period looks unimpressive. It is represented here by the blue line, and records a return of only 39.35% for the same period.
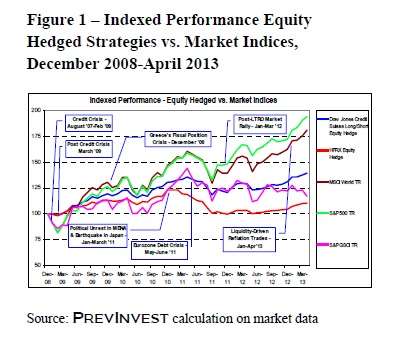
Notice that the orange line in that figure, the lowest of these candy-colored stripes since December 2010, represents the HFRX Equity Hedge index. It returned only 10.51%.
The above comparisons involve a same period of four years and a third. A defender of the performance of some of the funds under discussion might rejoin that the period is an arbitrary one.
But the results don’t improve when other periods are adopted. Over the 12 month period ending with March 2013, or over the 36 month, or over the 60 month period ending then: however sliced, the numbers look bad.
Size and Virtue
What does size have to do with it? One common intuition holds that that smaller funds should do better than the larger ones: that the nimble monkeys, not the lumbering elephants, grab the bananas. But the data under review don’t necessarily support that. “In fact, the top quintile performance [among long/short managers] over the 36-month period ended March 2013 was achieved with an average of US$111 million in assets, while the bottom quintile performance over the same period was achieved with an average of US$76 million in assets.”
What happened? Well, first, in the post-crisis world, certain traditional forms of stock-picker virtue have gone unrewarded. Knowing the company that issues a stock and its business plan, knowing the competition it faces and the demand it seeks to satisfy, the traditional ingredients of fundamental stock analysis, has been of very little help. Rather “macroeconomic themes and information flows” have dominated: the economic policies of nation states, legal considerations, the risk-on/risk-off rhythmic section.
Another sort of traditional virtue has become much more difficult: portfolio diversification. Long/short equity works best when equities are in fact diverse, when there is a wide range of performances across stocks. This has not been the case of late.
PrevInvest concludes that the hedge fund industry has to redouble its efforts at fining true uncorrelated returns, and adds that this “might mean revising and adapting the process of portfolio allocation in order to avoid chasing market returns on a relative basis.”
The Omega Ratio
The PrevInvest analysis goes a good deal further than our brief summary can. As a coda, I’d like to say a bit about a relatively recent metric it features: the Omega ratio.
The Omega ratio, described by Con Keating and William Shadwick in 2002, is defined mathematically thus:
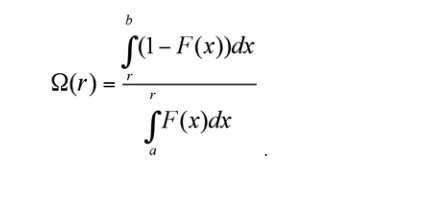
In English, this entails splitting the distribution of return into a portion that is above and a portion that is below a return threshold, then considering the probability weighted ratio of returns above and below the same threshold. Intuitively, there are “winners” and “losers” as defined for example by the risk-free rate of return, and the Omega ratio gets right to the task of measuring their respective weights.
Over the 60-month period ending in March 2013, 48.25% of the funds with a long/short equity strategy had a higher Omega ratio than the S&P500 total return index. The average AUM of funds beating the S&P500 TR index re: their Omega ratio was $174 million. The average median, on the other hand, was $78 million.
These results, PrevInvest concludes, “pave the way for further investigations about the statistical significance of a relationship between fund size and performance.”