

 It is an old and one-would-hope familiar lesson, but not for that reason an unnecessary one. We don’t take down warning signs on the hypothesis that they’ve become too familiar, after all. A cliff is still a precipice; a guard dog is still a danger to strangers, however familiar the words of warning are.
In that spirit, Commonfund Hedge Fund Strategies Group, in a new white paper, cautions against the common temptation to “chase winners,” that is, the investor itch to select hedge funds that have produced impressive recent performance.
The paper, by Kristofer Kwait and John Delano, begins with the observation that many managers [within the population of several thousand active hedge fund managers] have benefitted from the “extended broad market updraft” since the bottoming-out of the global financial crisis five years ago. For an allocator the draw of these “outsized recent winners can be powerful,” and Kwait and Delano put it.
Momentum Play Only
Kwait and Delano ran a simple experiment on the database offered by the HFRI Fund Weighted Composite managers. They constructed portfolios based on the most recent rolling evaluation period, for periods of varying length.
In the graph here, taken from that in the report, the right-hand horizontal metric (X axis) indicates for how long a period the pre-allocation evaluation extended. Were the hot hands picked based on their performance over the preceding 8 months? Or 18? Or longer? This axis shows evaluation periods ranging from 8 months at the far right to 60 months (5 years) at the left end of this axis. Unfortunately, in this reproduction the labels are cut off on that side, but you do get the shape of the surface inside the cube.
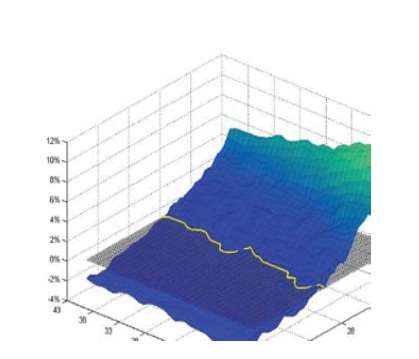
Source: HFRI, Commonfund
Note: Performance reflects hypothetical portfolio returns created using HFRI Fund0-Weighted Composite
The left-side horizontal metric (Y axis) indicates the holding period of a winner-chasing allocator’s portfolio, that is, the period for which a given “slot” in the evaluator’s portfolio is occupied by a particular manager. This extends, moving leftward, from 8 months to 43.
The vertical metric (Z axis) is the annualized performance of this fund versus average performance. In this case, “average” means the performance achieved by random selection for a period of 13 years beginning with January 2000. This average is represented graphically by the grey flat plane that looks at first glance as if it may be the shadow of the green-blue plane that especially interests us.
You’ll see that the cube extends from a floor of -4% returns to a ceiling of 17%.
The image then is of a results-revealing plane that slopes within the cube formed by these axes. The best result, the highest point on the sloping plane, comes from the shortest evaluation period, and the shortest holding period. It represents an extreme “momentum” strategy only.
Key Points
The key point to register from the shape of that blue-green surface is that the five year evaluation period to the side yields results below those of that boring gray flat surface: worse than average. And, though there is some variation by holding period, that is a distinction without much of a difference – by the time the evaluation period gets to five years, the result of chasing winners makes the allocator who follows that policy himself a loser, regardless of the holding period.
What if, counter intuitively, the allocator chases losers? He’ll do considerably better.

Source: HFRI, Commonfund
Note: Performance reflects hypothetical portfolio returns created using HFRI Fund0-Weighted Composite
You see the consequences of that strategy here. In the shorter evaluation term, this strategy is beneath the gray average surface. But at the five year limit, the loser-chasing strategy makes of the allocator a (modest) winner.
An important negative point noted in the report, though, is that none of this suggests that the allocators may as well just throw darts at a board.
Go back to the strategy of picking winners, but redefine who counts as a winner. This time look not at absolute recent returns but at alpha. One of the key purposes of a measure such as “alpha” after all is to abstract from the effects of a boom. Accordingly, you might expect that alpha would regularly outperform absolute return as a manager-selection guide. And on that, Commonfund assures you, you would be right.