

 Is there a bubble in oil and gas stock prices? And is it now bursting?
Those are pertinent questions in the face of the leading role the energy sector played through the first full week of October in the slide of the key U.S. stock indexes.
For perspective, we might remind ourselves that this doesn’t look at all like September 2008.
One the other hand, the more worrisome hand, it might remind some people of the later part of 2007, when stock prices remained high, though they were trending down, and when it was gradually becoming clear that the ‘subprime crisis’ would not be easily contained.
But let’s focus on 2014
The DJIA opened October 6th at $17,093.18. Only one of the five days that followed (Wednesday) saw an upward move, following the release of Federal Reserve minutes. The other four days’ results far overwhelmed that, though, and the week ended with the Dow at $16,544.10. That’s a loss of more than 3%.
Not so bad? Perhaps not. Zoom back a bit more though. On September 19th, the Dow hit $17,279.74. Measuring from that point, roughly a month ago, the loss is now 4.26%. Okay, still not terrible, less than half way to the “correction” threshold, but enough to make you wonder if there is something going on more than random noise.
Focus now on the Dow Jones U.S. Oil and Gas Index (DJUSEN) . Here things get intriguing. The DJUSEN began the week at $755.43, but ended it at $708.40. This is a loss of more than 6%.
Further, if you take DJUSEN back to September 19th, the overall index’s recent peak, you see that it closed at $796.03. That means that since then, DJUSEN has fallen almost exactly 11%, more than the standard definition of a market correction. And half of that in just the last week.
And that’s a quite conservative way to look at this. If we went back to the recent peak in DJUSEN itself we’d go to the start of the summer. In June of this year the energy sector got above $850. The fall from that height puts the size of our correction in the neighborhood of 16%.
Think about October 10th Now
Focus just on Friday, October 10th now. Let’s look at some of the biggest losers among the components of DJUSEN. In just that one day Diamondback Energy Inc. lost 4.52% of its market cap, Targa Resources Corp. lost 4.59%, and SM Energy had the real slam-bang day of the lot, down 7.35%.
Diamondback is an exploration and development company focusing on the reserves of the Permian Basin. SM Energy, likewise, is an upstream or production-oriented concern. Targa, though, is in the industry’s midstream, that is, it focuses on the transportation, storage, or wholesaling of energy commodities.
So, what would an energy-stock bubble in the stock price of such concerns look like?
It might look like sustained increase in stock prices over a period of a little less than 3 years unjustified by any change in fundamentals over that period, say an increase from $504.52 in September 2011 to above $850 in June 2014.
What was happening to the costs, and/or the products, of the relevant industry while the stock prices were on the way up during those nearly-three years? If either the costs were headed down or the product prices were headed up – that is, if the margins were increasing – then the increase in stock price has an obvious rationale. If neither is the case (or if they’ve been moving in tandem) well, the bubble hypothesis is on the table.
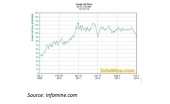
You see the crude oil price moves in the chart at the top of this blog entry. That is a five-year chart taking us back to January 2009. Through the first two years of the chart there is a steady increase, driven largely by demand from China. But right at April 2011 that increase … stops. And thereafter, until earlier this year, the price has plateaued. It is a rather ruggedly topped plateau, but it is a plateau, with oil trading around $110 a barrel.
In the price of gasoline over the same period, the same pattern appears over the same period. Through the period in question, the average price of a gallon of gas in the U.S. varied from a high of $3.99 to a low of $3.22, staying within striking distance of $3.60 from each side. But there was no directionality to its veers.
Defining Bubbles
In general, such fundamental considerations do not tell us why the price of stocks in traditional energy companies has gone up as much as it has recently.
Let’s recall the definition of a bubble. Ross M. Miller, of Miller Risk Advisors, has defined it as the circumstance in which “buyers are willing to overpay for an item in hopes that a greater fool will emerge who is willing to pay an even higher price. When the supply of fools dries up, the price falls, often quite rapidly.”
One final quote will complete today’s train of thought. Antony Mueller issued this warning about the connection between monetary policy and micro-level realities a decade ago now: “When monetary authorities repeatedly act to ward off economic downturns and continue to feed the markets with fresh liquidity, the belief in an eternal boom becomes more widespread each time, and economic activity becomes more intensive. With the continuation of such a boom, prudence diminishes….”