

 There are three kinds of lies: Lies, damned lies and statistics.--Benjamin Disraeli
Investors equate “alpha” to outperformance. A high alpha fund presumably delivers substantial excess returns relative to its benchmark. True alpha is short hand for manager skill. As we know, idiosyncratic returns can improve the risk adjusted returns of a diversified portfolio, and hence investors will pay high fees for “alpha.” Unfortunately, as a general rule, alpha is widely misunderstood and misused.
Statistically, alpha simply is the result of a linear regression between two return streams. The regression finds the straight line (ordinary least squares) that best fits the time series. Visually, beta is the slope of the line and alpha is where it crosses the vertical axis. The calculation was designed to uncover managers who outperform simply by taking on more risk. A manager who leverages to outperform the S&P in an up year will show a high beta but no alpha. Conversely, a manager who took less risk yet matched the S&P will have a beta of less than one and may show meaningful alpha. This analysis makes sense when you have two very similar investments. For instance, if a US-focused large capitalization mutual fund consistently earns 1% per annum more than the S&P with similar risk (beta), we’d expect to see alpha of around 1% per annum.
As with all quantitative analysis, however, the devil is in the details. Importantly, alpha is always relative to something else: change the benchmark and it means something very different. Use a different time period (window), and the results vary. Past alpha often does not translate into future alpha.
In this note, we look at two examples that are particularly relevant to hedge fund investors: where monthly data is imperfect and when the chosen benchmark is not representative of the underlying portfolio.
Imagine that we’re looking for a long-biased fund. In a screen of potential managers, we find a fund (Fund A) that has roughly matched the performance of the S&P 500 over the past five years – no mean feat given that the vast majority of mutual funds underperformed. Yet Fund A did this with less risk, as measured by a beta of 0.8 and a lower standard deviation, and delivered impressive alpha of 2.71% per annum. Summary statistics are below and the calculation of alpha and beta is shown in the scatterplot to the right (note: the scatterplot shows monthly data net of LIBOR, so alpha will be roughly twelve times where the line crosses the y axis):
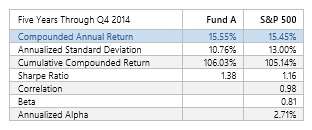
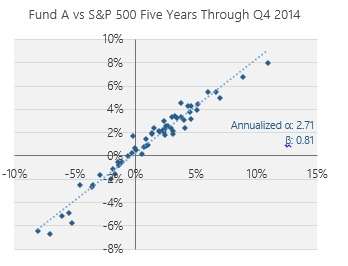
Most investors would leap at the opportunity to invest. There’s a catch, however. Fund A is simply the S&P 500 with moderate smoothing. While less of an issue, perhaps, with mutual funds, the level of smoothing is comparable to that of many hedge fund portfolios. Statistically, smoothing depresses beta and causes a commensurate increase in alpha. In this case, lower risk and “excess returns” are entirely attributable to a statistical quirk.
Now imagine that we are looking for an absolute return manager to add diversification to our portfolio. To diversify a traditional portfolio, we are seeking a fund with low correlation to equities. Fortunately, we find a fund, Fund B, that has demonstrated negative correlation to the S&P 500, yet has managed to outperform LIBOR by over 400 bps per annum over the past five years. With beta of close to zero, the fund has generated alpha of over 500 bps per annum relative to the S&P 500.
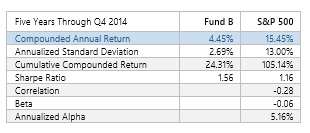
Many investors would conclude that Fund B offers valuable diversification benefits. Low correlation to equities is very valuable in the seventh year of a raging bull market, and returns of 400 plus over LIBOR – while maybe not what we expected pre-crisis – certainly looks compelling given where rates are today.
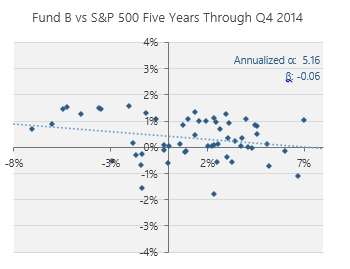
As shown in the scatter plot, in contrast to the chart for Fund A, the data points are distributed somewhat randomly. This makes sense: when the S&P 500 has a good month, it doesn’t mean that Fund B will as well. The result, though, is that the linear fit that determines alpha and beta hardly inspires confidence – drop a few outliers or change the time period and you can envision the line shifting around. The concept of “excess returns” then becomes much harder to support.
Sadly, Fund B is simply the Barclays Aggregate index. Rather than adding a unique and value added return stream, our allocation to Fund B simply has increased our exposure to fixed income – and probably at the wrong time. Using alpha and beta as evaluative metrics for very different return streams can lead to wildly misleading results.
Contrary to the concept of “excess returns”, alpha is not transitive. That is, if A has alpha to B, and B has alpha to C, if does not mean that A has alpha to C. In fact, and perhaps more confusingly, even when A has alpha to B, B can have alpha to A. While this shouldn’t be an issue when using an accurate benchmark, you can get a sense of the issue when we compare the S&P 500 to Fund B. As shown below, over the same period the S&P 500 also shows alpha to Fund B:
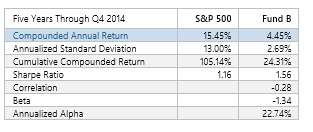
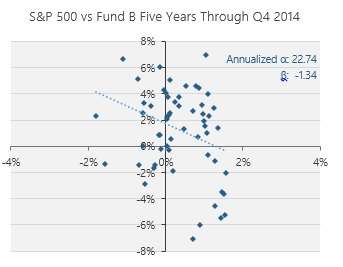
In the analysis, as a result of the negative correlation between the two returns, annualized alpha of 22.74% is substantially higher than actual compound annual returns of 15.45%. Again, this seems to violate the concept of “value added” or “excess returns.”
So, what does this tell us?
First, inaccurate data seriously undermines calculations of whether a manager is adding value or not. Returns smoothing continues to be an issue in hedge fund returns for unaudited monthly numbers (weekly numbers are worse). Granted, the issue is less pronounced than during the pre-crisis years, when hedge funds tended to own a higher percentage of illiquid assets. Even with more accurate pricing, however, there are more subtle issues that can affect whether the reported monthly return is accurate. For instance, international stocks close at a different time than US markets and futures markets close earlier than physical markets – an upward or downward move late on the last day of the month won’t be picked up in markets that have already closed. On a manager level, does it makes sense to price a stock holding at the closing price when a fund, such as a 9.9% activist position, cannot actually trade at this price?
Second, metrics like alpha and beta are only useful with accurate benchmarks that reflect the underlying assets of a fund. Hedge funds complicate the issue by investing in a variety of asset classes and by shifting exposures over time. This gets into thorny questions about how best to determine the right combination of benchmarks over a given period of time. There’s no perfect answer here. We’ve found replication models far better than anything else because they are adaptive and dynamic; as with any good model, though, it’s important to understand the pros and cons.
Third, in many cases, the calculation of “alpha” doesn’t fit the short hand of either excess returns or manager skill. Moderately negative correlation to a high performing asset – such as the S&P 500 over the past five years – can result in estimates of alpha that exceed actual returns. As noted, two managers can have alpha relative to each other.
Fourth, results will vary depending on the time period chosen. One approach is to look at rolling alpha, but this can suffer from the paucity of data points for any given window and results tend to be unstable. A related issue is that the correlation structure of the market changes over time: an unexpectedly large drawdown during a market crisis can reveal sources of risk taking (e.g. selling puts) that aren’t apparent in stable environments.
To draw upon Daniel Kahneman’s work, investors have a natural inclination to search for easy answers. “Alpha” as a concept has great appeal since it allows investors to condense all the complexities of “added value” into a single metric. It enables us to quantify in simple terms the value proposition of active management: a low beta manager is less risky, a high alpha manager adds value. Statistical models are incredibly useful and have meaningfully improved our understanding of pernicious issues like undeclared leverage and hidden correlations. However, as with many elegant ideas, it’s incredibly important to pay close attention to the assumptions. Otherwise, we’ve got a big garbage in-garbage out problem.
Andrew Beer, CEO: At Beachhead, Mr. Beer oversees all marketing and research efforts and is influential in portfolio construction. Mr. Beer began his career in mergers & acquisitions at the James D. Wolfensohn Company, a boutique firm founded by the forthcoming President of the World Bank. Mr. Beer worked in leveraged buyouts at the Thomas H. Lee Company in Boston during his tenure at Harvard Business School. Upon graduating, he joined the Baupost Group, a leading hedge fund firm, as one of six investment professionals. Additionally, Mr. Beer co-founded Pinnacle Asset Management (leading commodity fund) and Apex Capital Management (Greater China hedge fund). Mr. Beer is an active member of the Board of Directors of the US Fund for UNICEF, where he serves as Chairman of the Bridge Fund, an innovative financing vehicle designed to accelerate the worldwide delivery of life-saving goods to children in need. With his wife, Mr. Beer is a co-founder of the Pierrepont School, a co-educational K-12 independent school located in Westport, CT. Mr. Beer received his Master in Business Administration degree as a Baker Scholar from Harvard Business School, and his Bachelor of Arts degree, magna cum laude, from Harvard College.