

 The latest Eurekahedge report says that in April, Asia ex-Japan funds delivered the best returns in the hedge fund industry, up 8.26%. This success was driven by the Greater China mandated funds, which benefit from optimism about “aggressive stimulus measures by the Chinese central bank.”
Breaking the industry down by strategy: long/short equity funds were the standouts of the month, and have been the standouts for the year to date, too.
More intriguingly, though, the new Eurekahedge report includes a section on key trends in the specific and beleaguered world of funds of hedge funds.
Performance, Good: Flows, Bad.
The upshot of it is that, on the one hand, there is a “strong case” to be made for that sector, given its strong returns, declining fees and reduced redemption periods. But, on the other hand, the FoHFs haven’t successfully made this case of late. Investors are continuing to disintermediate at their expense. Risk aversion over the continuing crises in the European sovereign debt markets has hurt FoHFs, and the rise of new products such as hedge fund trackers has “set the industry AUM into a downward spiral” from which it has yet to recover.
The contrast between the black on the left column of the table below and the red on the right column indicates that these two contrary trends [FoHF success on performance and failure as to marketing] encompass the first quarter of this year.
The figures below are in US$billions, rounded up to one decimal place.
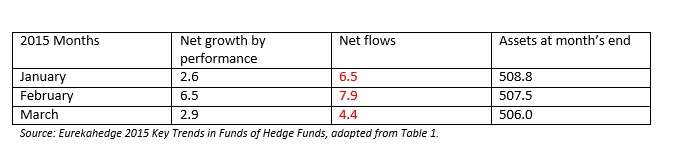
Net outflows come to $18.7 billion during this period, which overwhelms the performance gain of $12 billion. Further, this net outflow is the highest in any quarter since the second quarter of 2013.
The report also looks at the regional investment mandates for FoHFs since August 2011. Globally mandated funds have been hardest hit, seeing an AUM decline of about 32% since that start date.
North America is the outlier. Funds of funds with a North American mandate have actually received positive net inflow over this period. Concomitantly, North America has become the largest mandate, overtaking global.
Strategic Mandates, Fees, and Redemptions
Breaking the numbers down for the same period but by strategic mandate, Eurekahedge finds that CTA/ managed futures oriented FoHFs saw a net inflow of $10.8 billion, or roughly 17%. The data provider observes, though, that much of that increase came about in 2012 specifically, and there has been a decline since the start of 2013.
One attractive feature of CTA/managed futures strategies, and one that works to the advantage of FoHFs with such a mandate, is the low correlation between their results and the traditional market indexes.
But let’s talk about fees!
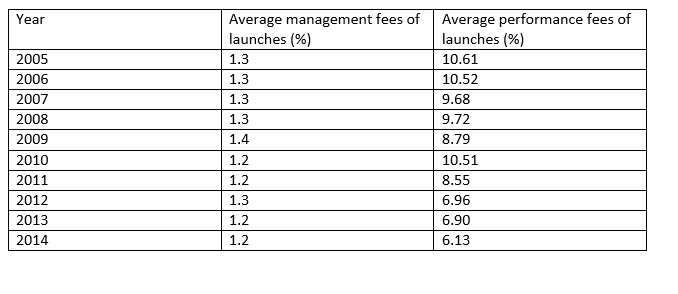
Source: Eurekahedge 2015 Key Trends in Funds of Hedge Funds, adapted from Table 2
The downward spiral in demand for the services of FoHF management has shown up in the fees that the market will allow them to charge.
The effect is much more marked on the right-hand side of the table above than it is on the left; that is, more marked for performance fees than for management fees.
Note that twice during this covered period there was a year over-year increase in management fees (2009 and 2012), but that both of those years saw a decrease in performance fees.
If you, as a manger of a FoHF, are interested in wooing back a disintermediated investing client, one of your selling points might be this: your industry’s redemption notification period has shortened significantly of late. The average number of days in the redemption period was 57 back in pre-crisis 2006. It had fallen to 36 in 2010. It has fallen still further since, to 32 in 2014.
That’s a decline of 44%, or a considerable improvement in liquidity one would think.