

A new white paper from Campbell & Co. discusses the negative skew that is often a characteristic of portfolio returns, and the ways in which trend following can achieve positive skew instead. The paper is effectively advertised by its title, “Taming of the Skew.”
The authors begin with distinctions among three ways to manage risks in the trend-following context: constant risk targeting, signal risk targeting, and equity risk targeting. A brief explanation of the differences forms the following table.
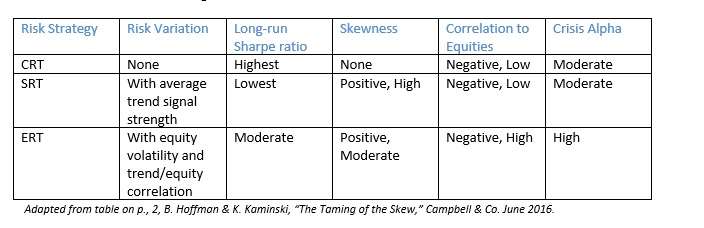
Adapted from table on p., 2, B. Hoffman & K. Kaminski, “The Taming of the Skew,” Campbell & Co. June 2016.
Start with a definition
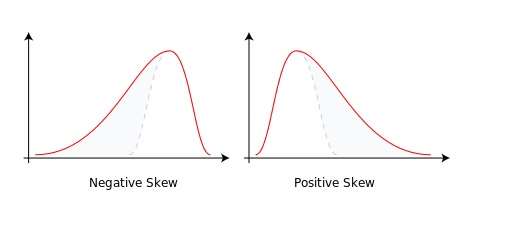
Skewness is a measure of asymmetry around the average return. As the simple examples of skewness below illustrate, the longer left tail indicates a negative skew, which is thus also called a left skew: contrariwise with the positive or right skew.
As a general rule (with exceptions) in unimodal distributions such as those below, the mean will be to the right of the median in a right skew and to the left of the median in a left skew. Of course for the zero skew bell curves; mode equals mean which equals median.
In applying these notions to portfolios, though, the authors of the white paper – Brendan Hoffman, PhD and Kathryn Kaminski, PhD CAIA – distinguish between the point in time distribution on the one hand and the time-series distribution on the other.
What We Observe: It’s Raining
The point-in-time distribution is the distribution of potential return outcomes at any given moment. Hoffman and Kaminski write, “As the number of markets … gets larger and these markets are sufficiently independent, the portfolio’s point-in-time return distribution will approach a normal distribution.”
This is where an analogy to weather comes to mind. Of course at any one moment our actual return is simply what it is; it isn’t a range. Likewise, on a certain day the skies above me are either raining or they aren’t. There is no “observing” the distribution of portfolio outcomes any more than one can “observe” the chance that the rainy day might have been sunny, or the smaller chance that it might have been snowy.
What the investors do observe is a series of events, and differing returns/weather, over time. In a time series distribution, one gets an aggregation of portfolio returns over time. Likewise, what we weather watchers observe is the actual precipitation on actual days in the one actual universe.
The first of the three risk management styles in the table above, constant return targeting, depends on the principle that a portfolio that maintains constant volatility over time will also, like the point-in-time portfolio mentioned above, possess a normal time-series distribution, and thus that it will have a zero skew.
The paper shows how, if a portfolio’s Sharpe ratio is positive, toggling risk back and forth between a high-risk and a low-risk target will produce a positive skew over time. This could be accomplished even if the toggling is determined by coin flips, where “heads” means high risk and “tails” means low risk.
The authors of course aren’t recommending a heads/tails strategy. They use it as a logical transition into signal risk targeting; a portfolio strategy that talks the same amount of risk over long time periods as CRT but that varies in the short term, “naturally with the average trend signal strength across markets.”
QQ Plot of the monthly returns of the trend-following strategy under signal risk targeting (SRT) from January 1990-May 2016. The distribution is shown in the lower right with a normal distribution in red for reference.
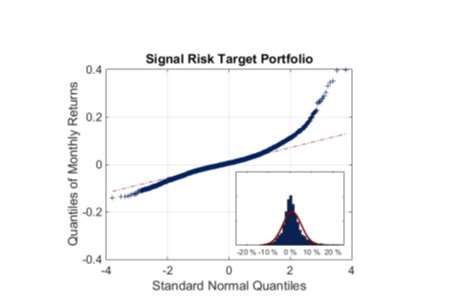
Source: B. Hoffman & K. Kaminski, “The Taming of the Skew,” Campbell & Co. June 2016, p. 10.
The authors offer important caveats about the value of SRT in the face of potential equity drawdowns. Large returns can occur under this strategy, but they occur when trend signals are large in aggregate” and “may not align in time with large returns from other allocations (such as equities) which limits their potential impact.”
If an investor is looking for improved performance during equity crises, though, the better approach to varying a portfolio’s risk targets over time, the authors say, is the third one listed above: equity risk targeting. In ERT, the risk target will depend on the level of equity volatility as well as the negative correlation of the portfolio to equities.
Thereby it will build one an umbrella against that particular sort of rain.