


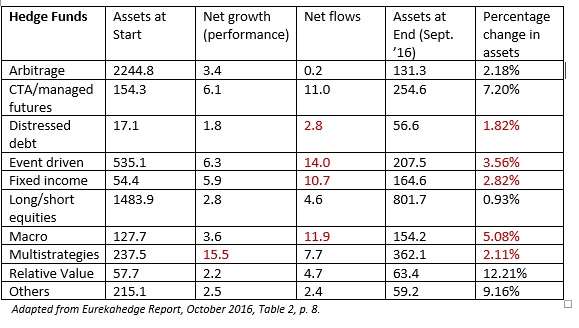
The event-driven hedge fund space is the most troubled in a generally troubled time for the industry. According to the new Eurekahedge report, the event-driven strategy “has seen US$14 billion investor redemptions over the past nine months,” and $10.7 billion over just the past six months.
The first nine months of 2015 also saw net outflow for this strategy, but it was a net outflow of roughly one-ninth that of YTD 2016.
Macro and fixed-income hedge funds, as well as the macro folks have also seen outflows in 2016 YTD, though not as severe as their event-driven brethren. Multi-strategy saw a significant gain via investor flow, although it was only half what their loss in performance was.
On the other hand, the CTA/managed futures strategy has successfully resisted the general industry doldrums, and saw its investor inflow for 2016 YTD reach $11 billion, with positive performance in the bargain. The positive performance (and perhaps the inflows as well) may be due to optimism about the ability of the oil producing countries to halt and perhaps reverse the decline on the price of their product.
Overall, the year to date picture, broken down by strategy, is shown in the table below. All US dollar figures are in billions, and rounded off to one decimal place. Red ink denotes loss or outflow.
Market participants are of course always intensely interested in the outcome of the U.S. presidential elections. This cycle is no exception. Eurekahedge observes that investors generally expect a Clinton win, but that they are cautious, because the Brexit vote recently taught them the lesson that “the polls may not be telling it all and democracy may yet undermine itself again in 2016.”
The Volatility Indexes
Eurekahedge also keeps us up-to-date with the CBOE Eurekahedge Volatility Indexes. There are three squally-weighted indexes involved: long volatility; short volatility; relative value; tail risk. Long and short vol mean what they sound like they mean, but some readers might benefit by a refreshed definition of the other two. The relative value index tracks the performance of those managers who trade vol opportunistically with a goal to absolute return.
The tail risk index tracks managers who, in the words of the report, “specifically seek to achieve capital appreciation during periods of extreme market stress.” Investors typically put money into such a fund as a way of taking out insurance against another ‘black swan’ event such as a terrorist attack or the failure of a ‘too big to fail’ financial institution, they are run on the theory that ‘conventional’ financial models understate the likelihood of such events and so ‘insurance’ is available cheaper than its actual value.
On a YTD basis, the relative value index is doing best, up 6.7%. See the bar graph below.
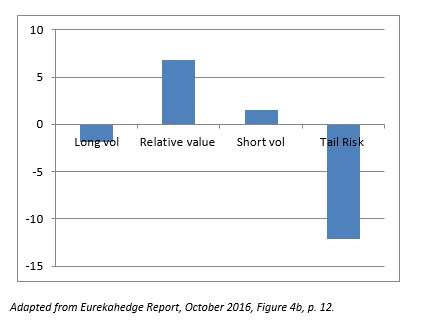
Adapted from Eurekahedge Report, October 2016, Figure 4b, p. 12.
Looking specifically at the Month of September, the ranking of the four indexes turns out to be … the same as YTD. Relative value best, tail risk worse, long vol slightly down, short vol slightly up.
Long/short equity
Long/short equity isn’t just one strategy among many. It accounts for nearly 36% of the assets under management of the whole industry. So Eurekahedge takes a close look at its performance specifically, and not just over the month of September or even 2016 YTD but over the whole period since the start of 2008.
During this period of seven and three-quarters years, long/short equity hedge funds have posted gains of 4.43% which compares quite favorably with the MSCI World Index. During up markets, L/S managers lag the underlying markets, and the “bull run” of 2013 was an outstanding example of this. But they do a fine job of preserving capital during down markets.
Since there is a “brand name” effect in the L/S equity world, the medium- to small-sized managers, who cannot sustain the same branding effect, have suffered in recent years.
Also in this space, it is worth noting that average performance and management fees for the newly launched funds are both in decline.