


Summary
- Dividend yielding stocks can make a meaningful contribution to a portfolio in international markets as well as domestic.
- Higher returns are not always associated with higher risk.
- High dividend investing has been beneficial over most years and investment horizons.
- An emphasis on dividends appears to contribute across cycles, sectors and markets.
Introduction
Domestic equity investors have long understood the importance of dividends. A dividend policy can be valuable beyond the income it provides as investors can gain confidence in the company’s financial strength.
What may be overlooked is that dividends can play at least as important a role on a global scale.
Dividends Clearly Matter
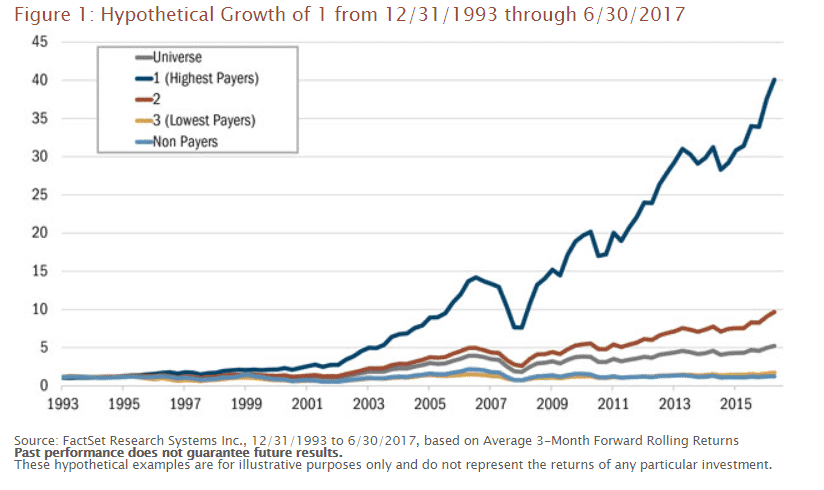
To explore the contribution dividends make in global markets, we studied the performance of equity securities from outside the U.S. from 12/31/1993 through 6/30/2017* focusing on companies with market capitalizations greater than or equal to $100 million, and less than or equal to $5 billion. This study demonstrates that non-U.S. small- to mid-capitalization stocks with dividend yields have historically produced higher levels of total return than non-dividend payers. The level of dividend yield also played a role in the results.
The graphics below show returns for this universe grouped into thirds by dividend yield, as well as a separate category for companies that don’t pay any dividend. Over the entire period, the equal-weighted annual returns for the universe of securities averaged 6.95%. In contrast, stocks that paid dividends averaged a 8.85% total return. Returns on stocks that didn’t pay any dividend were 2.09%.
The level of dividend yield also was tied to returns. The top third yielding stocks produced a return of 14.95% compared to a return of 1.91% for the bottom third.
These results are similar to studies demonstrating long-term outperformance among domestic value strategies, including a focus on stocks with low price/earnings (P/E) ratios, as well as those with low price/book (P/B), and low price/cash flow (P/CF). A high dividend yield indicates a low price relative to a financial fundamental (dividends), and low P/E, low P/B, and low P/CF also imply a low price relative to financial fundamentals.
Value strategies may outperform because investors become too pessimistic about the prospects for stocks trading at cheap valuations, with the result that prices are driven down even further until they become oversold. Value investors capitalize on this excess concern by identifying unduly inexpensive stocks in anticipation the market will eventually recognize the overreaction. This is not to say that all inexpensive stocks are sound investments. Low multiples are warranted for some companies. As with any singular screening mechanism, additional research is called for to further assess the potential outlook for a stock.
Greater Efficiency
Efficient market theory suggests that higher returns should be accompanied by higher risk. Dividend paying stocks, despite higher levels of return, had lower risk (standard deviation) than the broader universe as well as lower beta than non-dividend paying companies.
Further, stocks that didn’t pay dividends had much higher risk to go along with their lower returns. Therefore, on a risk-adjusted basis, dividend payers were better with higher yielding names outperforming those with low or no-yield. Stocks in the top third had a Sharpe ratio of 0.55, versus 0.20 for the broader universe. Also, the information ratio for stocks in the top third was 0.71, versus -0.77 for those in the bottom third. In sum, dividends contribute to total return while also helping to create a more attractive risk profile for a stock.
Holding Period Impact
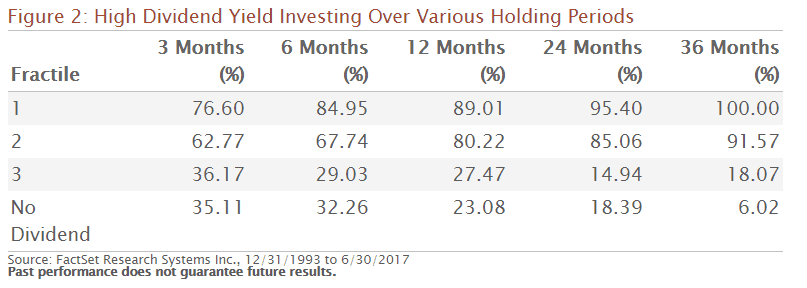
Since many investors do not have the over 20-year investment horizon shown in our first table, we also considered the impact of dividend investing over various shorter spans. The table below shows the percentage of periods in which the stocks in a particular grouping based on yield outperformed the broader stock universe.
The results are compelling. High yielding stocks outperformed in 100% of the three-year time periods. Even over the shortest time period considered (three months), the top group outperformed nearly 77% of the time. These results demonstrate dividend investing’s viability over both longer and shorter time frames.
The Impact of Market Cycles
Since investing does not take place in a static environment, we examined how high dividend yield stocks perform in a variety of market cycles. The following graphs show the excess returns of stocks in the top third by yield versus their broader universe over one- and two-year holding periods, from 1994 to the present.
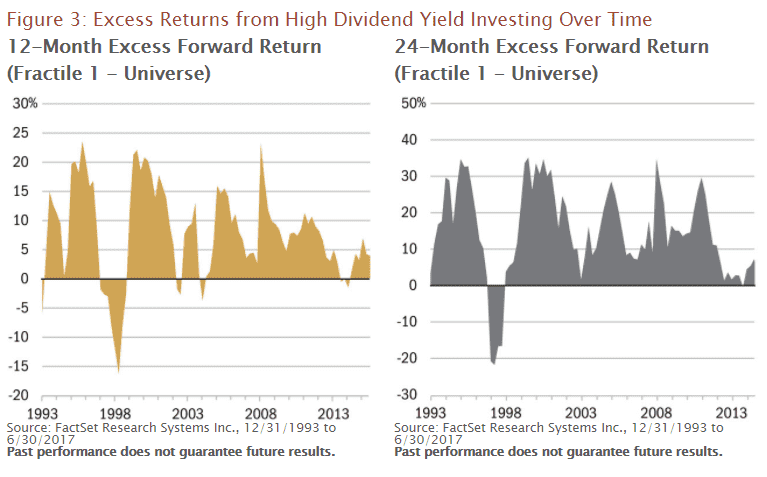
During the internet bubble, financial bubble, and the beginning phases of economic expansion in the early 1990s and 2000s, relative returns from yield investing waned. High yield investing showed better returns, however, during most other market periods.
The table in the bottom of Figure 3 shows the efficacy of yield strategy during quarters representing various market environments. Over the time period considered, there were 58 quarters when the universe was up, and 36 when the universe was down. During down markets, dividend paying stocks in the top fractile outperformed 94% of the time. This appears to align with performance of value-investing strategies in general, which typically perform better when markets are depressed. During markets with positive returns, the high dividend stocks still outperformed a respectable 66% of the time.
High Dividend Investing has Worked in Most Sectors
High yield stocks are often associated with specific sectors, and these results could be skewed by over- or under-weights among them. To explore this impact, we examined dividend investing specific to individual areas of the market. We first bundled the stocks in our universe into a number of different groups, which included industries categorized into sectors, and industries combined to form growth, defensive, and cyclical super-sectors. Within each group—as well as the broader universe—we then subtracted the returns of the low- yielding stocks in the bottom third of dividend payers from those in the top third.
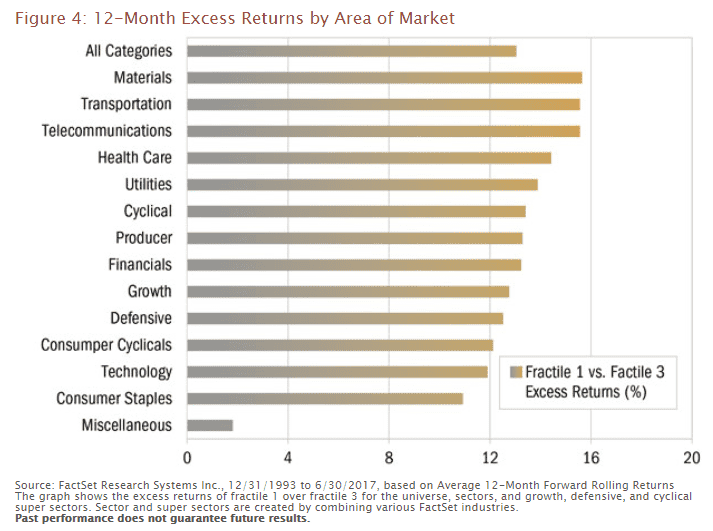
The results shown in the graph above indicate that investing with a focus on higher yielding stocks can be an effective strategy irrespective of sector.
Improving the Model
While there is a great deal of evidence supporting the benefits of high dividend yield investing, it is prudent for portfolio managers to rely on more than just this factor when making decisions. Some stocks pay attractive dividends because of their financial stability, robust earnings, and commitment to shareholders. Others may produce high yields while undergoing extreme and perhaps irreversible duress, or may only be achieving them with unsustainably high payout ratios. So while a dividend screen seems to be a useful component in the evaluation process, we are not suggesting that it stand alone.
The tables below show how combining dividend yield with a number of other fundamental criteria might help further refine stock selection. Criteria we considered are P/B (to look for modest valuations), one-year dividend growth (an indicator of earnings growth), and payout ratio (a potential measure of safety). Each panel shows a total of nine fractiles: three for dividend yield, times three for the additional factor, within the dividend payer universe. Generally, fractile one represents the best third—the highest yield, lowest P/B, highest growth, and lowest payout ratio—while fractile three represents the less desirable end of the spectrum.
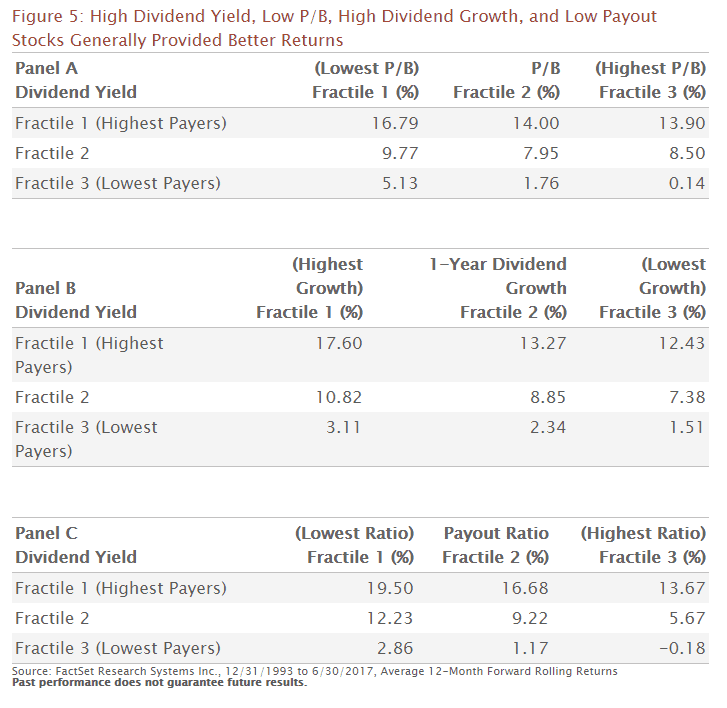
The data illustrates that adding low P/B, high dividend growth, or low payout to the selection criteria in each case appears to improve the model over a dividend yield only approach. These are certainly not the only quantitative screens that can be used, but they aptly illustrate that the employment of a combination of factors may have an even greater potential to outperform than using the dividend component alone.
*This paper utilizes data sourced from the FactSet Fundamentals global database from 12/31/1993 through 6/30/2017. Statistical tests were run in FactSet Alpha Testing software. Stocks with dividend yields above 100% and below 0% were classified as not available, but are included in the Universe. In total, there were 772,837 possible data items. Companies in the resulting data set were segmented as divided payers and non-dividend payers. Dividend payers were further grouped into three fractiles based on yield, with fractile 1 representing the highest payers and fractile 3 representing the lowest. Dividend yield was calculated as annual dividends divided by the current share price, and fractiles were rebalanced every three months. Equal-weighted total returns for each fractile and the universe were computed for three, six, 12, 24, and 36 months.
Past performance does not guarantee future results.
An investor should consider the Funds’ investment objectives, risks, and charges and expenses carefully before investing or sending money. This and other important information may be found in the prospectus (pdf). To obtain a print prospectus, call 800-432-7856. Please read the prospectus carefully before investing.
The International Value Fund invests primarily in small foreign companies selected on a value basis. Such securities generally are more volatile and less liquid than those of larger companies. Foreign securities have additional risk, including but not limited to exchange rate changes, political and economic upheaval, and relatively low market liquidity. These risks are magnified in emerging markets.
Value investments are subject to the risk that their intrinsic value may not be recognized by the broad market.
There is no assurance that dividend-paying stocks will mitigate volatility.
Dividend-paying stocks cannot eliminate the risk of investment losses. Dividends are not guaranteed and a company’s future ability to pay dividends may be limited. A company currently paying dividends may cease paying dividends at any time.
Sector and industry classifications as determined by Heartland Advisors may reference data from sources such as FactSet Research Systems Inc. or the Global Industry Classification Codes (GICS) developed by Standard & Poor’s and Morgan Stanley Capital International.
Hypothetical examples are for illustrative purposes only and do not represent the returns of any particular investment. There is no guarantee that any particular investment strategy will be successful.
Heartland’s investing glossary provides definitions for several terms used on this page.
The Heartland Funds are distributed by ALPS Distributors, Inc.
The statements and opinions expressed in the articles or appearances are those of the presenter. Any discussion of investments and investment strategies represents the presenters' views as of the date created and are subject to change without notice. The opinions expressed are for general information only and are not intended to provide specific advice or recommendations for any individual. Any forecasts may not prove to be true.
Robert C. Sharpe
Sharpe is Vice President and Portfolio Manager of the International Value Fund. He has 34 years of industry experience, 4 at Heartland.
Dr. G. Kevin Spellman
Spellman, CFA, is Senior Lecturer and Director of Investment Management Certificate Program at the University of Wisconsin-Milwaukee’s Lubar School of Business. His academic experience includes Durham University (UK), the IE Business School (Madrid), The Ohio State University, and the University of Wisconsin-Madison. He has investment experience working at the State Teachers Retirement System of Ohio and CUNA Mutual. He holds a Ph.D in Accounting and Finance from Durham University (UK), M.S. in Finance from the University of Wisconsin-Madison, and a B.S. in Finance from the University of Wisconsin-La Crosse.