


By Daniel Fang, CFA, CAIA, Quantitative Research, and Diana Olteanu-Veerman, CFA, Quantitative Strategy, Northern Trust Asset Management
Composite Equity Issuance (Cei) Can be a Proxy for Intangible Returns Anomalies
Even though factor investing is widely supported in academia and investment practice, forecasting and harvesting factor returns remains challenging for various reasons. One signal that has received more than a little attention of late is share buybacks.
In this paper, we discuss some of the flaws with using buybacks on their own as a forecasting metric and highlight that a more holistic view of shareholder activity both addresses these flaws and potentially helps explain the portion of stock returns not due to changes in fundamentals. In doing so, we take a novel approach to decompose this more holistic metric, known as Composite Equity Issuance (CEI), to isolate the elements of equity capital structure decisions.
A recent research was done by Northern Trust Asset Management to study efficacy of CEI as factor. The research used equity return and equity fundamental data from 1969 to 2018 for the U.S. and 1998 to 2018 for World ex U.S. and Emerging Market. The research shows this CEI metric has historically generated higher returns and Sharpe Ratios than buybacks around the globe. Indeed, we see this is empirically the case with CEI outperforming a net share issuance measure (includes both buybacks and share issuances) in the U.S., World ex U.S. and Emerging Markets*[1] annually by 1.4%, 2.2%, and 0.3%, respectively, with meaningful improvements in risk-adjusted measures as well.
The CEI anomaly was first documented by Kent Daniel and Sheridan Titman in their 2006 paper, Market Reaction to Tangible and Intangible Information [1]. In their paper, the authors break down stock returns into intangible and tangible components and conclude that the return associated to changes in accounting metrics – the tangible return – has no predictive power on future stock returns. In other words, everything that is known from an accounting perspective at a given time appears to be priced in. However, the intangible return, which reflects expectations of firms’ future earnings and growth potential, does account for pricing anomalies.
The difficulty, of course, is identifying metrics that can forecast intangible returns, which is where CEI comes into play. As a proxy for intangible information, the authors find that, when adding CEI to a multivariate regression that includes tangible and intangible return proxies, “the composite share issuance variable [that is, CEI] is significantly negatively related to future returns, providing further evidence that stock prices perform well (poorly) subsequent to the realization of unfavorable (favorable) intangible information”. Note that a high CEI implies a growth in the shareholder base and can be viewed as ‘unfavorable’. In other words, a change in composite share issuance has information about future stock returns. The implicit assumption behind using CEI to proxy intangible returns is that a firm’s management has better information than what is reflected in financial statements, thus their reaction to share price in the form of issuance or buybacks contains relevant information. Through an understanding of CEI and its underlying components, we can attain a greater understanding of the relationship between CEI and intangible returns.
Composite Equity Issuance Decomposition
At a high level, CEI “measures the amount of equity the firm issues (or retires) in exchange for cash or services. Thus, seasoned issues, employee stock option plans, and share-based acquisitions increase the issuance measure, while repurchases, dividends, and other actions that take cash out of the firm reduce the issuance measure.” To help simplify this description, we take the original CEI formula and decompose it into two elements: change in shares outstanding and dividend yield.
The original mathematical form for composite equity issuance can be found in Daniel and Titman 2006 paper and shown below:
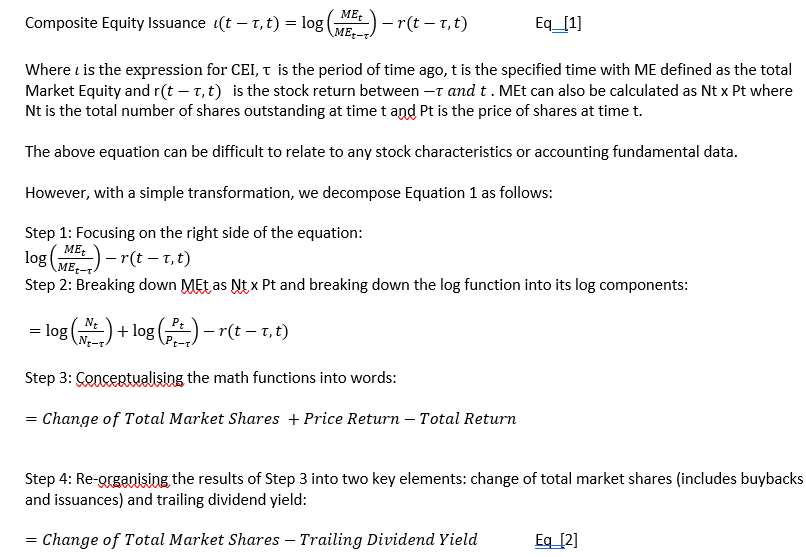
From equation [2], it is obvious that composite equity issuance is comprised of two basic factors:
- Share Changes (including issuances and buybacks) and
- Dividend yield
In the next section, we focus on the individual components of Equation 2.
Share Changes and Dividend Yield: The Whole is Greater Than the Sum of The Parts
Share changes – including buybacks and issuances – and dividend yield are well-known measures that help understand management’s views on valuations and potential business opportunities:
- Share changes are mostly due to share buyback programs and, to a lesser extent, secondary share issuances. Share buybacks can take several forms including open market, private transactions, and Dutch auctions but the most well-known and used ones are open market share buybacks. A traditional view for stock buybacks is that they are a positive signaling from management that their stock is undervalued and thus makes a good “investment”. Conversely, when companies issue stock, this can create an impression of the firm taking advantage of high stock valuations. Buybacks and issuances can also be used to change the capital structure of the firm. Within the low-interest rate environment since the financial crisis, relatively cheap debt has made debt financing more attractive than equity financing. As a result, buybacks have become a more dominant form of earnings distributions in the U.S [4] generating an intense debate over their merits.[2]
- The dividend yield has been a hallmark for value investors for at least since Ben Graham wrote The Intelligent Investor and Security Analysis books over 70 years ago. A company that pays a consistent and stable dividend that is well covered by its internally generated cash flows can be considered healthy and profitable. Raising dividend payouts is widely seen as a signal that a company’s management is confident in the company’s ability to generate future cash flows while cutting dividends can be seen as a negative sign of the company’s future earning power as well as a potential signal to the marketplace that the company needs to reserve liquidity for other purposes, often-times related to solvency.
Though share changes and dividend yield have been useful forecasting variables independently, we find that combining them into a single metric provides a more potent effect because it considers the interaction of the variables. For example, a company may issue shares (viewed negatively) to maintain or increase its dividend (viewed positively). Taking these together allows the investor to view changes to the entire equity capital base. Of course, companies buy back their stock for several reasons, some wholesome, others more ambiguous. These include tax related, corporate actions, signaling, pressure from activist hedge funds [6], and employee stock options. Although outside the scope of this paper, an investor’s best defense to these issues with buybacks is to take a more holistic view of a company’s fundamentals that includes profitability and cash flow measures – collectively what we refer to as Quality.[3]In the next section we look at the empirical analysis surrounding the efficacy of share changes, dividend yield, and the combined CEI metric.
In Exhibits 1 – 3, we show the returns of share changes, dividend yields, and the combined CEI measures across Russell 1000, MSCI World ex U.S., and MSCI Emerging Markets indexes.
In our research, for each region, we create equally weighted portfolios split across five quintiles where Quintile 1 - Q1 represents the lowest CEI and Share changes and the highest dividend yield while Quintile 5 - Q5 represents the opposite.
Exhibits 1 to 3 show annualised returns and information ratios for these portfolios.
Exhibit 1: Russell 1000
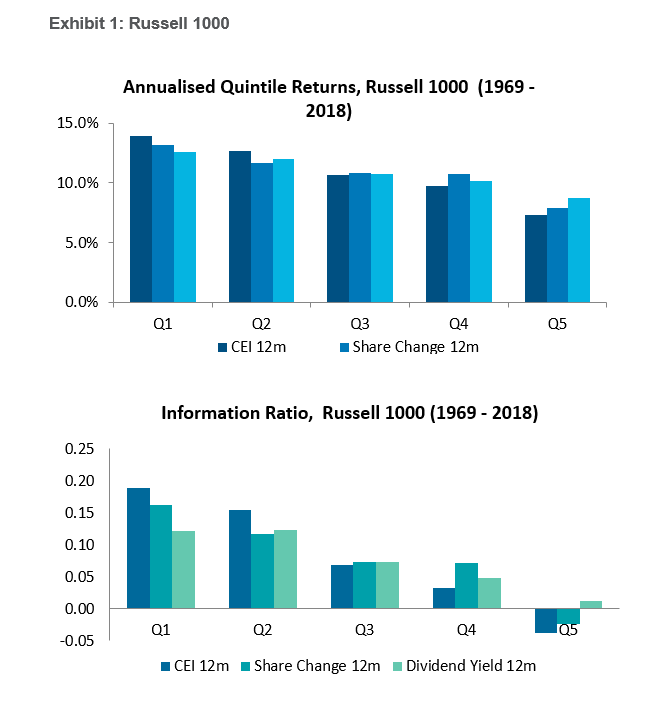 In the U.S. market, the Q1 portfolio for CEI outperformed Share Change by 77 bps and Dividend Yield by 131 bps on an annualised basis, respectively, over the last 50 years. The top two quintiles for CEI are visibly better performing than those for Share Change and Dividend Yield. In addition, the dispersion of returns and risk adjusted returns between the top and bottom quintiles is higher for CEI than for the other two measures, which further supports the CEI’s efficiency.
Exhibit 2: MSCI World ex U.S.
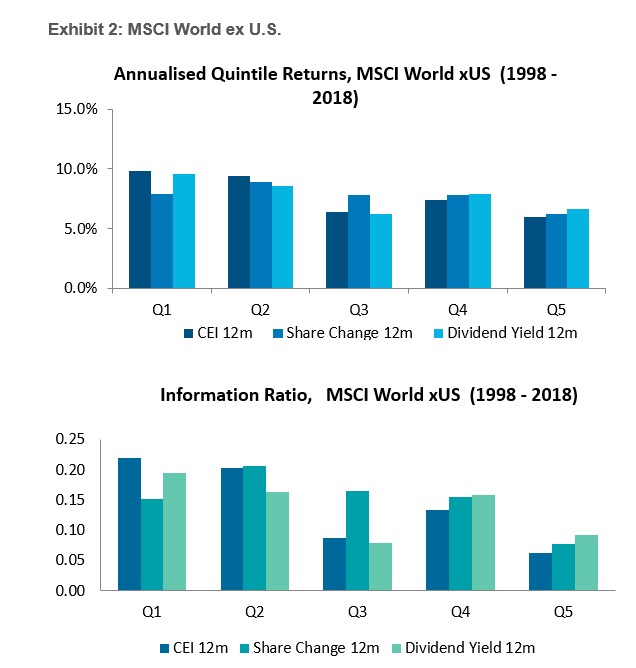
In the World ex U.S. market, the Q1 portfolio for CEI outperformed Share Change and Dividend Yield by 192 bps and 27 bps on an annual basis, respectively, over last 20 years. Although the return dispersion between the top and bottom quintiles is somewhat smaller than in the U.S., we still see the same general pattern, supportive of CEI in developed international markets.
Exhibit 3: MSCI Emerging Market
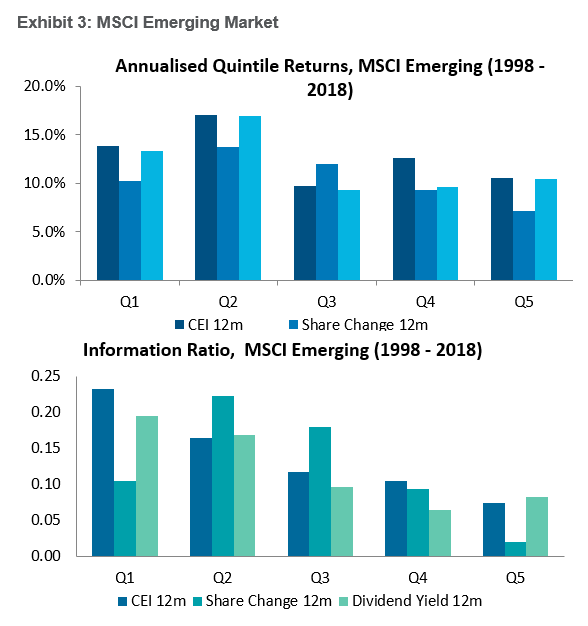
Lastly, in the Emerging Markets, the Q1 portfolio for CEI outperformed Share Change and Dividend Yield by 368 bps and 58 bps on an annual basis, respectively over the last 20 years. While the return dispersion across the quintiles is somewhat more varied than in the Developed markets there is still a significant differential between the top and bottom quintiles especially on a risk adjusted basis.
Across the globe, we see the positive effects of using CEI to capture changes in equity capital structure rather than looking at Share Change and Dividend Yield individually. In this case, the whole signal is indeed greater than the sum of the parts.
CEI is a Useful Proxy to Intangible Returns
Understanding stock pricing anomalies is a critical step to being able to harvest them in one’s equity portfolio.
In the case of the stock market, it can be helpful to decompose a stock’s total return into a tangible piece related to changes in fundamentals, and an intangible piece that incorporates all other information. Although there are no direct metrics for the intangible return, one proposal would be to look at the Composite Equity Issuance (CEI) as a useful proxy to help forecast intangible returns. In this paper, we discussed and decomposed CEI into its component parts and demonstrated how it is an improved measure to its individual components, including Share Buybacks. Using metrics that take a holistic view of the interaction between firm’s management actions and shareholder activity like CEI may improve investors’ ability to understand and forecast stock return anomalies.
References
[1] Kent Daniel and Sheridan Titman, 2006, Market Reaction to Tangible and Intangible Information, Journal of Finance
[2] Robert Stambaugh, Yu Yuan, 2016, Mispricing Factors, The Review of Financial Studies Business
[3] Kent Daniel and Sheridan Titman, 2014, Another Look at Market Responses to Tangible and Intangible Information, Critical Finance Review
[4] Douglas J. Skinner, 2008, The Evolving Relation between Earnings, Dividends, and Stock Repurchases. Journal of Financial Economics
[5] Fangjian Fu and Sheng Huang, 2015, The persistence of long run abnormal stock returns: Evidence from stock repurchases and offerings, Management Science 62
[6] Farre-Mensa, Michaely and Schmalz, Financing Payouts, Ross School of Business, 2018
[7] Almeida, Fos and Kronlund, The Real Effects of Share Repurchases, Journal of Financial Economics, 2016
IMPORTANT INFORMATION
The information contained herein is intended for use with current or prospective clients of Northern Trust Investments, Inc. The information is not intended for distribution or use by any person in any jurisdiction where such distribution would be contrary to local law or regulation. Northern Trust and its affiliates may have positions in and may effect transactions in the markets, contracts and related investments different than described in this information. This information is obtained from sources believed to be reliable, and its accuracy and completeness are not guaranteed. Information does not constitute a recommendation of any investment strategy, is not intended as investment advice and does not take into account all the circumstances of each investor. Opinions and forecasts discussed are those of the author, do not necessarily reflect the views of Northern Trust and are subject to change without notice.
This report is provided for informational purposes only and is not intended to be, and should not be construed as, an offer, solicitation or recommendation with respect to any transaction and should not be treated as legal advice, investment advice or tax advice. Recipients should not rely upon this information as a substitute for obtaining specific legal or tax advice from their own professional legal or tax advisors. Information is subject to change based on market or other conditions.
Past performance is no guarantee of future results. Performance returns and the principal value of an investment will fluctuate. Performance returns contained herein are subject to revision by Northern Trust. Comparative indices shown are provided as an indication of the performance of a particular segment of the capital markets and/or alternative strategies in general. Index performance returns do not reflect any management fees, transaction costs or expenses. It is not possible to invest directly in any index. Gross performance returns contained herein include reinvestment of dividends and other earnings, transaction costs, and all fees and expenses other than investment management fees, unless indicated otherwise.
Northern Trust Asset Management is composed of Northern Trust Investments, Inc. Northern Trust Global Investments Limited, Northern Trust Fund Managers (Ireland) Limited, Northern Trust Global Investments Japan, K.K, NT Global Advisors Inc., 50 South Capital Advisors, LLC and investment personnel of The Northern Trust Company of Hong Kong Limited and The Northern Trust Company.
© 2019 Northern Trust Corporation. Head Office: 50 South La Salle Street, Chicago, Illinois 60603 U.S.A.
[1] U.S., World ex U.S. and Emerging Markets investment universes as described herein are defined by the Russell 1000 index, the MSCI World ex USA index, and the MSCI Emerging Markets index, respectively.
[2] Share Buybacks: Facts or Fantasy for a more in depth discussion on this topic.
[3] What is Quality? For a detailed discussion of what distinguishes a high quality company