


By Matt Malone, Managing Director, Real Estate and Andrew Korz, Associate, Investment Research, FS Investments As the COVID-19 pandemic has swept across the world, it has become clear that the necessary steps being taken by governments to protect human life have thrust the global economy into a recession. In the U.S., various forms of stay-at-home orders have been in place since mid-March, bringing economic activity to a virtual standstill and straining the U.S. commercial real estate (CRE) market. As certain types of tenants may struggle to pay rent, investors are questioning the ability of property owners to service their debt obligations. In this note, we examine the performance of the CRE debt market during the 2008 global financial crisis (GFC), compare the state of the pre-GFC and pre-COVID markets, and use this framework to analyze the potential impact of COVID-19 on the CRE debt market. We caveat this analysis with the fact that much remains unknown related to the virus, potential treatments and vaccines, and what life looks like post-COVID.
What happened last time?
While every recession is different, past downturns can provide a useful starting point. The 2008 downturn originated as a financial crisis, brought on by excess leverage, which bled into the real economy and caused a deep recession. The downturn was precipitated in part by overleveraging and lax underwriting in the real estate market—principally in the residential mortgage space, but CRE lending practices contributed as well. In the lead-up to the GFC, banks, CMBS and other institutional investors such as insurance companies dominated the lending market, making up nearly 95% of all CRE debt holdings. As a result, our GFC analysis will focus on these commercial loan types.[1] Before jumping into the data, it is important to make a distinction between delinquencies and defaults versus losses. We expect to see a spike in delinquencies and eventually defaults in commercial real estate debt—these figures always make headlines. From a long-term investor’s perspective, however, the most important number is actual losses. Starting with banks, which held 50% of all CRE loans at year-end 2007,1 delinquent loans steadily increased starting in late 2006. Both nonresidential CRE and multifamily loan delinquency peaked around 4% in Q3 2010 before declining from that point on. Over the same period, losses started to rise in 2008 and peaked at 1.16% in 2010. From 2008–2012, losses were 3.75% on a cumulative basis, or an annualized loss rate of just 0.74%.[2] 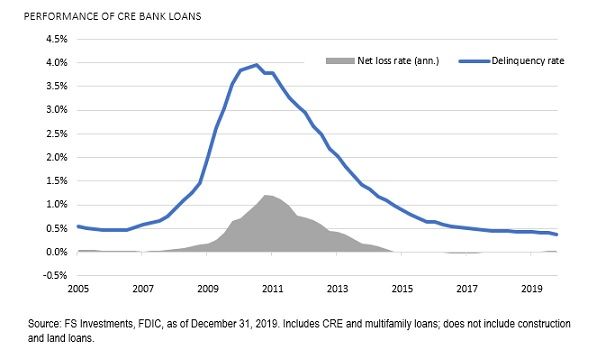 The second-largest source of debt capital for CRE borrowers leading up to the recession was the CMBS market, which comprised 23% of total debt outstanding in 2007.1 Delinquencies on CMBS loans rose steadily to a peak of between 5%–9% for most property types. Similar to banks, however, overall loss rates stayed lower.[3] Digging in a bit deeper, in contrast to banks, which hold whole loans, the securitization industry allows various investors to participate in the CRE debt market at a range of risk levels. For example, in the typical CMBS structure, various tranches of bonds with credit ratings ranging from AAA to below investment grade are issued to investors and secured by a specific pool of CRE loans. Each tranche of issued bonds has a certain level of “subordination” (or cushion against losses in the underlying loans), with the highest-rated bonds having the most cushion and the lowest yield, while lower-rated bonds carry a higher yield but a smaller cushion. From 2005–2007, the years leading up to the crisis, the market saw $649 billion of new issuance, still the most active period in CMBS market history. These deal vintages realized the most severe losses, ranging from 5.7% for securities issued in 2005 to 9.5% for those issued in 2007.3 However, the losses were mostly borne by lower-rated bonds such as BBB and BB rated, which carried average subordination of only around 3%–5%. Virtually no AAA-rated CMBS securities took losses, and around two-thirds of AA rated securities remained unscathed.[4]
 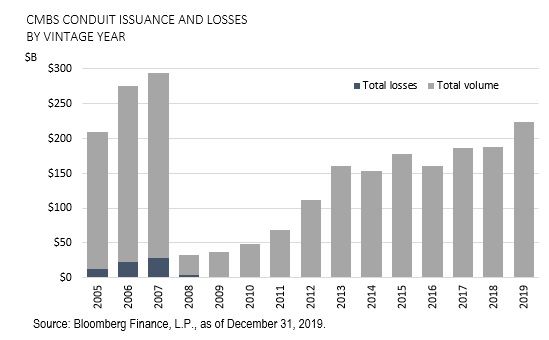 Finally, other institutional lenders, such as insurance companies and alternative lenders, represented about 21% of total debt outstanding.1 For this area of the market, we use the Giliberto-Levy Commercial Mortgage Performance Index, which measures the performance of commercial mortgages held on institutional lenders’ balance sheets. While the index does not publish default or delinquency data, it does report “credit impacts,” or losses. Credit impacts rose throughout the recession, peaking at 130 bps in 2011. However, as shown in the chart below, the income generation from the underlying loans more than offset any losses on an annual basis.[5]
 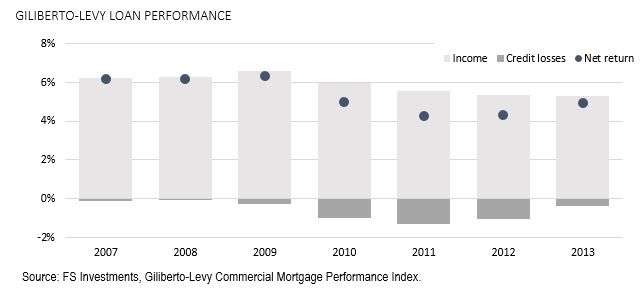 One key differentiator for the private loan market compared to CMBS is that CMBS securities are bought and sold on the public market, and thus are subject to market supply/demand dynamics. Because of this, even higher-rated CMBS bonds that were ultimately protected by significant subordination saw yields rise dramatically, eroding their market value on a temporary basis. Legacy AAA spreads widened past 1,000 bps in early 2009, implying an expected loss of more than 40%.3 In the end, no AAA bonds took any losses.4 In contrast, investors in private senior CRE mortgage loans did not endure this mark-to-market volatility. While credit losses did detract a total of about 5.3% in performance throughout the crisis, the index still returned 5.2% on an annualized basis from 2007–2012. To summarize, during the GFC the CRE market experienced an uptick in distressed debt. That said, loss rates were markedly lower across the major lender types.
- Bank CRE loan delinquencies peaked around 4% in 2010, and losses peaked at around 1.2%. Cumulative losses were about 3.75% for the entire crisis.2
- CMBS delinquencies peaked at 7.1% in 2010. Cumulative losses for the 2005–2007 vintage deals range from 5%–9%, although those losses were accumulated over more than a decade of seasoning.3
- While we don’t have delinquency data for other institutional lenders like insurance companies, annual credit losses peaked at 1.3% in 2011, similar to that of banks. Cumulative losses were 5.3%.4
What to expect this time around
The COVID-19 crisis has been unlike any we’ve seen in modern history. While the last recession was brought on by a financial crisis, the current downturn was sparked by a health crisis. The commensurate shutdown of public life has had an outsized impact on certain areas of the commercial real estate market, such as hotels and retail. Knock-on effects of the sharp deterioration in the labor market could have further impact on the multifamily and office sectors as well. A bright spot may be industrial, which was in high demand prior to this crisis and will likely see sustained demand as e-commerce activity increases. As with any downturn, the CRE debt market will see an uptick in defaults and losses. After hitting a decade-low delinquency rate of 0.4% in February, CMBS delinquency rates have started to tick up and leading indicators show we should expect that to continue. For timely data, we can use CMBS remittance reports, which outline performance of the underlying loans on a monthly basis. According to J.P. Morgan, about 86% of underlying loans are current and paid their May interest on time. At the time of the report, 5.7% of loans were more than 30 days late and just 1.3% were more than 60 days late. This compares to a GFC peak of 7.1% 60+ day delinquencies. The current stress is most evident in the hotel and retail sectors.3,[6] 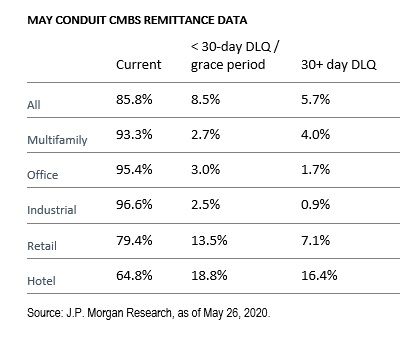 Despite the relatively benign figures for office, industrial and multifamily loans, the public markets saw a violent sell-off with spreads on all tranches of CMBS widening rapidly.
 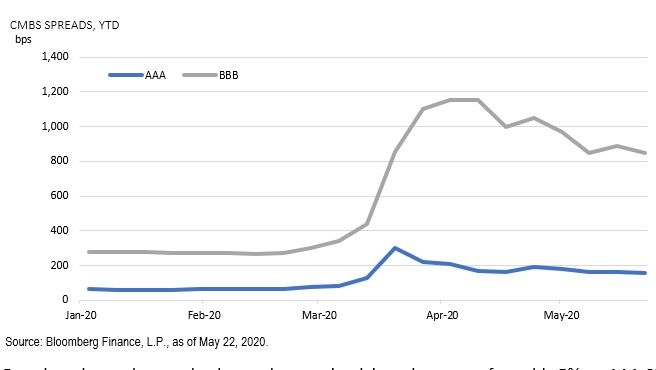 Based on the peak spreads, the market was implying a loss rate of roughly 5% on AAA CMBS.[7] Even in a draconian scenario this pricing seemed oversold, particularly given that the CRE debt market was in a much healthier place prior to the COVID-19 pandemic, as we covered in our prior research note. In this type of market, the ones taking losses are the traders, not necessarily those who can hold the securities longer term. J.P. Morgan ran a CMBS stress test, analyzing today’s market in the event of a GFC-style downturn. They found that 60+ day delinquencies would rise close to 5% in 2021, compared to a peak of 7% in 2010. In this scenario, they project aggregate losses would rise to 6%–9% depending on deal vintage. While this would be generally in line with pre-GFC levels, it is important to note that higher-rated bonds have more subordination (or cushion) than they did before the last crisis. Because of this, J.P. Morgan projects that the vast majority of A rated bonds would not take losses, while in the last downturn more than 50% of A rated securities were at least partially impaired.[8] For banks, data is released on a lag, so we don’t yet have access to timely data on their loans. Trepp has performed a scenario analysis on a basket of $77.5 billion of CRE bank loans that it tracks. In the stress test, Trepp assumed that CRE property prices would decline by around 35% over a two-year period, similar to what occurred in the GFC.[9],[10] In this “severely adverse” scenario, Trepp projects delinquency rates for CRE loans would reach an annual peak of 2.7%, a significant uptick from the March delinquency rate of 0.4% but below what the market experienced during the GFC. Additionally, Trepp projects a cumulative loss rate of around 2.7%, implying a loss severity (or losses as a percentage of defaults) of around one-third. As expected, Trepp estimates a wide dispersion in performance based on property type, estimating that hotel and retail sectors would experience a large uptick in delinquencies, while office, industrial and multifamily would be less impacted.9 Of course, nobody can perfectly predict the outcome of this crisis; too many variables remain unknown. However, it is clear that the CRE lending markets came into this environment much healthier than they did pre-GFC. To summarize:
- CMBS spreads have widened considerably YTD, and delinquencies are on the rise. J.P. Morgan forecasts that in a GFC-like scenario, serious delinquencies may peak at 5% in 2021, and cumulative losses for certain vintages could range from 6%–9%.8
- Trepp forecasts that in a “severely adverse” scenario, cumulative losses on CRE bank loans would reach 2.7%, lower than the 3.8% during the GFC.9
Bottom line So, what is there to glean from all this data? First, investors should remember not to get overwhelmed by rising delinquency figures and focus more on potential losses. Looking back at the GFC, the CRE debt market was much more highly levered and, as a result, poorly positioned to weather a market disruption. Even against that backdrop, cumulative losses were only around 4% for banks and private lenders, and somewhat higher for CMBS, resulting in an average annualized loss rate of less than 1%. Additionally, the private real estate debt market generated positive overall returns in each year during the crisis when income generation is taken into account. In any crisis there will be winners and losers—the COVID-19 pandemic is no different. Although commercial real estate lenders may experience challenges, those who have the liquidity, flexibility and capital base to take the long-term view will likely come out on top. [1] U.S. Federal Reserve, as of December 31, 2007. [2] FS Investments, FDIC, as of December 31, 2019. [3] FS Investments, Bloomberg Finance, L.P. [4] J.P. Morgan Research, CMBS Weekly, April 3, 2020. [5] Giliberto-Levy Commercial Mortgage Performance Index. [6] J.P. Morgan Research, CMBS Weekly Datasheet, May 26, 2020. [7] J.P. Morgan Research, FS Investments, using average of 2016–2019 conduit vintages. [8] J.P. Morgan Research. [9] Trepp, COVID-19 Impacts on Commercial Real Estate, March 2020. [10] Real Capital Analytics.
Interested in contributing to Portfolio for the Future? Drop us a line at content@caia.org