


By Kara O'Halloran, FS Investments The dog days of summer are upon us. While August has historically brought volatility to markets, equities in 2020 appear to have shrugged off their typical late-summer doldrums, posting solid gains to start the month. However, some warning signs are flashing of possible bumps ahead. In this note we discuss what the options market is telling us about potential volatility in the coming months—and what investors can do now to prepare. Historically, August has been a tough month for stocks. The average S&P 500 return in August over the past 15 years is -0.17%, and these meager returns are often accompanied by an increase in volatility. But equities have looked tame lately, with one-month realized volatility clocking in at just 10.2%, and the average daily move of the S&P 500 over that time period has been just 30 basis points. This market would feel extremely placid even under normal economic circumstances, let alone our current macro backdrop. Figure 1[i] 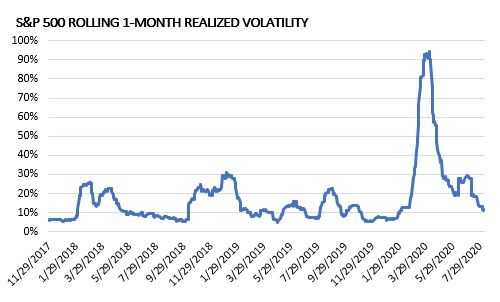 Markets are just a few months removed from the acute pain many experienced during March’s sell-off, when realized volatility reached 92%. As markets have recovered in extraordinary fashion, volatility has receded. But year-to-date realized volatility remains high from a historical context, at 41.35%, whereas long-term averages are in the mid-teens. With headline risks extreme—a pandemic, a looming U.S. presidential election and geopolitical tensions, to name a few—markets feel downright complacent. The dichotomy between implied and realized volatility measures would agree, as these signals in options markets are pointing toward heightened volatility ahead. Volatility ahead The most widely known measure of implied equity volatility is the CBOE Volatility Index, or the VIX. Sometimes called the “fear gauge,” the VIX is a measure of the market’s expectation of forward volatility and is derived from the price of options on the S&P 500. Options, which can be viewed as insurance premiums on their underlying assets, become more valuable amid higher levels of volatility as the likelihood that the insurance will be needed increases. When markets expect higher future levels of equity volatility, option prices increase and the VIX rises. Figure 2[ii]
 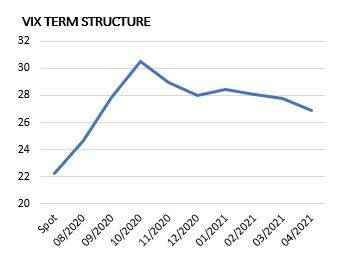 The term structure of the VIX shows expected levels of volatility at different tenors. Generally, the curve is upward sloping as uncertainty over the long term is, understandably, higher than in the near term. Now, however, the curve is kinked—markets expect higher levels of volatility for the next three months than over the longer term. This unusual dynamic highlights the extreme uncertainties that persist in markets today. Possibly even more foreboding than the standalone VIX curve is the current spread between implied and realized volatility. Realized volatility, which measures the actual movement of an underlying security (in this case the S&P 500), has been extremely low to start August. Even with the headline risk and uncertainties we still face, markets are not reacting. The spread between implied and realized volatility can be used to gauge where options traders think markets are heading. If realized volatility is higher than implied volatility, expectations are for volatility to subside. It is common for this type of relationship to be observed during turbulent periods—like this March, for example. Conversely, if implied volatility is higher than realized volatility, the general market expectation is for volatility to rise in the future. That’s exactly what we’re seeing right now. We’ll caveat this by saying that realized volatility is often lower than implied volatility by some margin. But the disconnect we’re now seeing between implied and realized volatility is at its highest level since August 2012. After the signal flashed then, one?month realized volatility increased from 6.1% to 16.4% over the next two months. Figure 3[iii]
 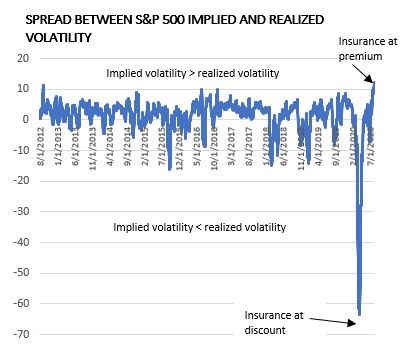 Said another way, options traders are currently willing to pay large premiums to protect against near-term equity risk. Positioning for volatility Many investors may have been caught unaware—and perhaps undiversified—when markets sold off in March. The decline was swift, and the exogenous nature of the shock left little time to prepare. Now, however, markets are near all-time highs and investors have the benefit of the recovery to rebalance portfolios in a time of strength. This may represent an opportunity for investors to reassess their equity risk and position portfolios for volatility ahead. We’ve written previously about the failures of traditional sources of diversification. In order to build truly diversified portfolios going forward, we believe investors will need to expand their horizons. Many liquid alternative solutions can provide minimal market dependence (i.e., low beta), low expected downside capture and low equity correlation. The graph below plots the universe of liquid alternative returns by Morningstar Institutional Category versus their 3-year equity market beta during the peak-to-trough sell-off earlier this year (February 20–March 23). Figure 4[iv]
 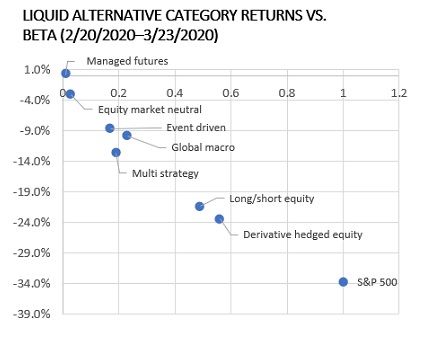 Unsurprisingly, categories less exposed to equity markets provided meaningful diversification during the sell-off, as evidenced by their low drawdown during March and low historic downside capture ratios.
 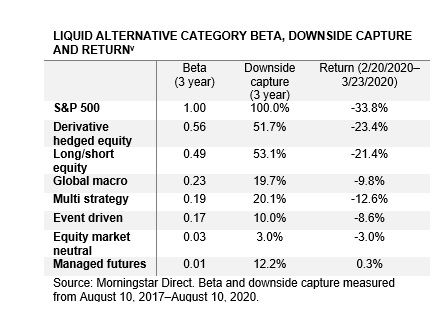 Entering 2020, many, including us at FS, anticipated having to contend with heightened volatility at some point this year. We listed the uncertainties we were closely watching: an ever-aging economic cycle, a U.S. presidential election, and geopolitical risks in the form of trade wars and rising tensions among nuclear powers. While nobody could have predicted all that 2020 has actually brought, we think it’s prudent to remember just how much more—beyond the lingering pandemic—markets are up against this fall. Signs of potential danger are beginning to flash. Will investors heed their warning? [i] Bloomberg. November 30. 2017-August 10, 2020. [ii] Bloomberg, as of August 10, 2020. [iii] Bloomberg. July 31, 2012-August 10, 2020 [iv] Morningstar Direct. Beta measured from March 31, 2017-March 23 2020. [v] Morningstar Direct. Beta and downside capture measured from August 10, 2017-August 10, 2020. For questions or comments, contact research@fsinvestments.com.
Interested in contributing to Portfolio for the Future? Drop us a line at content@caia.org