By Larry Kim, Managing Director, Portfolio Consultant, Simplify ETFs.
INTRODUCTION
With decades of both passive and active fund performance now in the rearview mirror, the results are unequivocal: active management within fixed income is incredibly compelling, while active management in equities has failed to deliver.
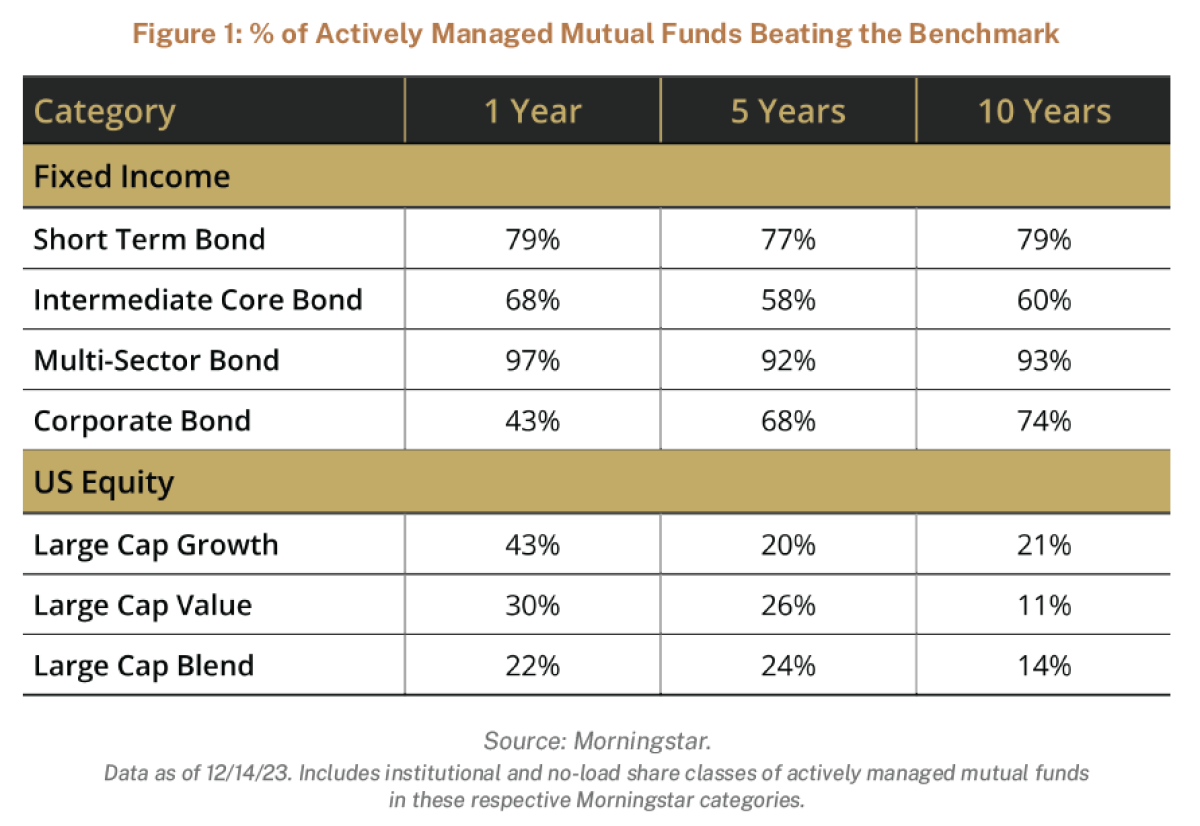
Let’s start by checking the scoreboard, shown in Figure 1. We see a very high percentage of actively managed fixed-income mutual funds were able to beat their benchmark over the past decade (last column), between 60% and 93%, depending on the asset class. On the opposite side of the spectrum are equity mutual funds, where only a small number of active funds outperformed their benchmark over the trailing decade, between 11% and 21%, depending on the asset class.
BOND INDEXES ARE BUILT DIFFERENTLY
There are many different types of indexes (e.g. price-weighted, equal-weighted, etc.), but for the sake of this discussion, we’ll stick with market capitalization-weighted indexes, which comprise the majority of passive assets in both fixed income and equities.
On the equity side, indexes are hard for active managers to beat because the weighting of each stock is determined by the collective wisdom of the market. The most heavily weighted stocks in the index are the ones that investors have voted on (with their dollars) as being the most desirable. With millions and millions of talented professional and non-professional investors researching stocks and pouring money into the best ones, it is very hard to outsmart the passive index mix.
It’s natural to assume that bond indexes are built the same as their equity cousins, after all, they are also market capitalization weighted. But there is a substantial difference between how that weighting is determined. With bond indexes, the cap weighting is not determined by the collective wisdom of the market – it’s driven by the supply of bonds. We can see how this works by looking at the Treasury allocation within the Bloomberg Aggregate Bond Index (Figure 2).
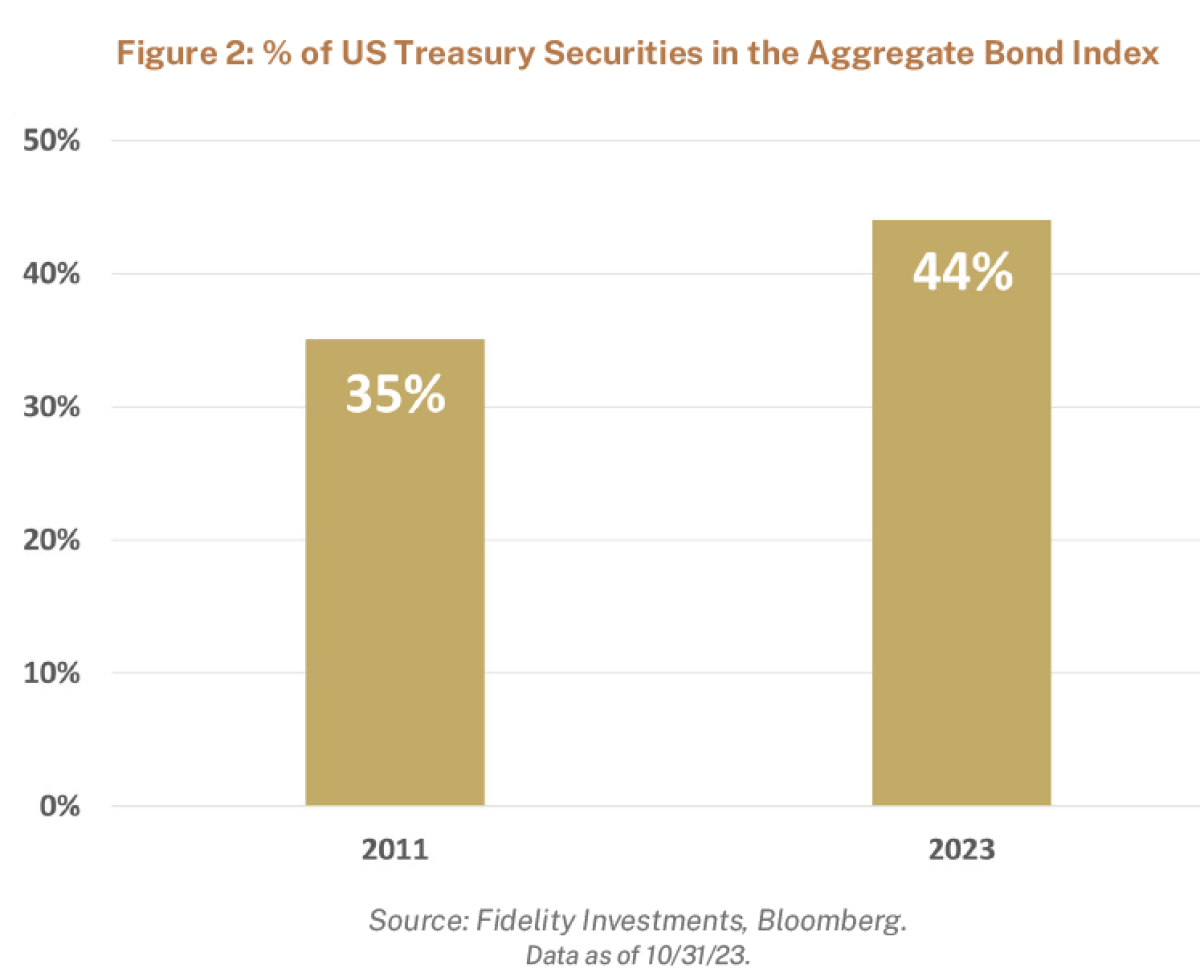
The percentage of Treasury securities in the index has increased significantly, from 35% in 2011 to 44% in 2023. Is this because the collective wisdom of the market has decided that Treasuries are a more attractive investment in 2023 than they were in 2011? No.
It’s because the number of Treasuries issued over the past decade has dramatically increased, as the US Government has needed to fund an increase in budget deficits. In fact, this dramatic increase in deficits has caused at least one rating agency (Fitch) to downgrade its ratings on Treasuries. If an entity increases its issuance, then its weighting in the index increases; the more indebted an entity becomes, the higher its weighting. It is this dynamic that creates opportunities for active bond managers. Unlike equity indexes, bond indexes don’t follow the collective
wisdom of the market—they just get filled with entities with the most debt. Active managers however don’t have to select securities by issuance, they are free to select securities with attractive investment fundamentals instead.
INTRODUCING THE SIMPLIFY AGGREGATE BOND ETF (AGGH)
AGGH is an actively managed core bond fund with an investment objective of maximizing total return. The goals for AGGH are as
follows:
- Create similar fixed income exposure as the Bloomberg Aggregate Bond Index in terms of duration and credit quality
- Provide a higher distribution yield than the index
- Outperform the index on a total return basis
There are several levers that can be pulled in search of greater yields and returns. The next section will review this investment process.
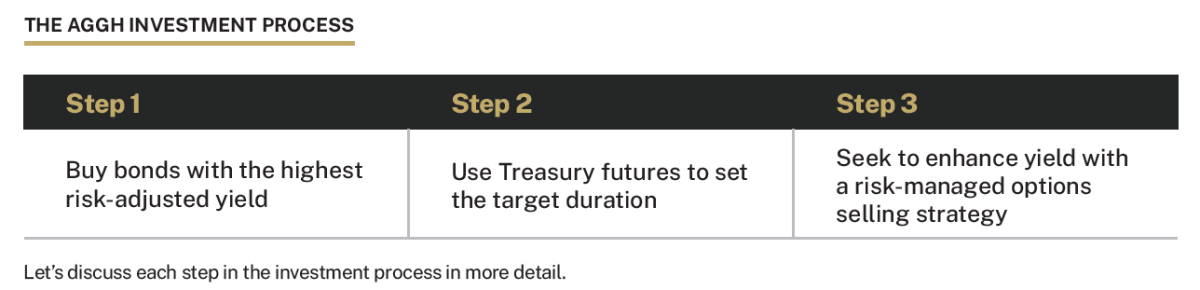
Step 1
The first step is to buy bonds with the highest risk-adjusted yield. This is the primary lever in active management – buying the sectors of the bond market, but not by issuance, by fundamentals. The fund will seek out the highest yields available without increasing the
fund’s credit risk. Here are some examples of how this process works. Keep in mind that holdings can change at any time, so these examples are simply used to demonstrate the investment process.
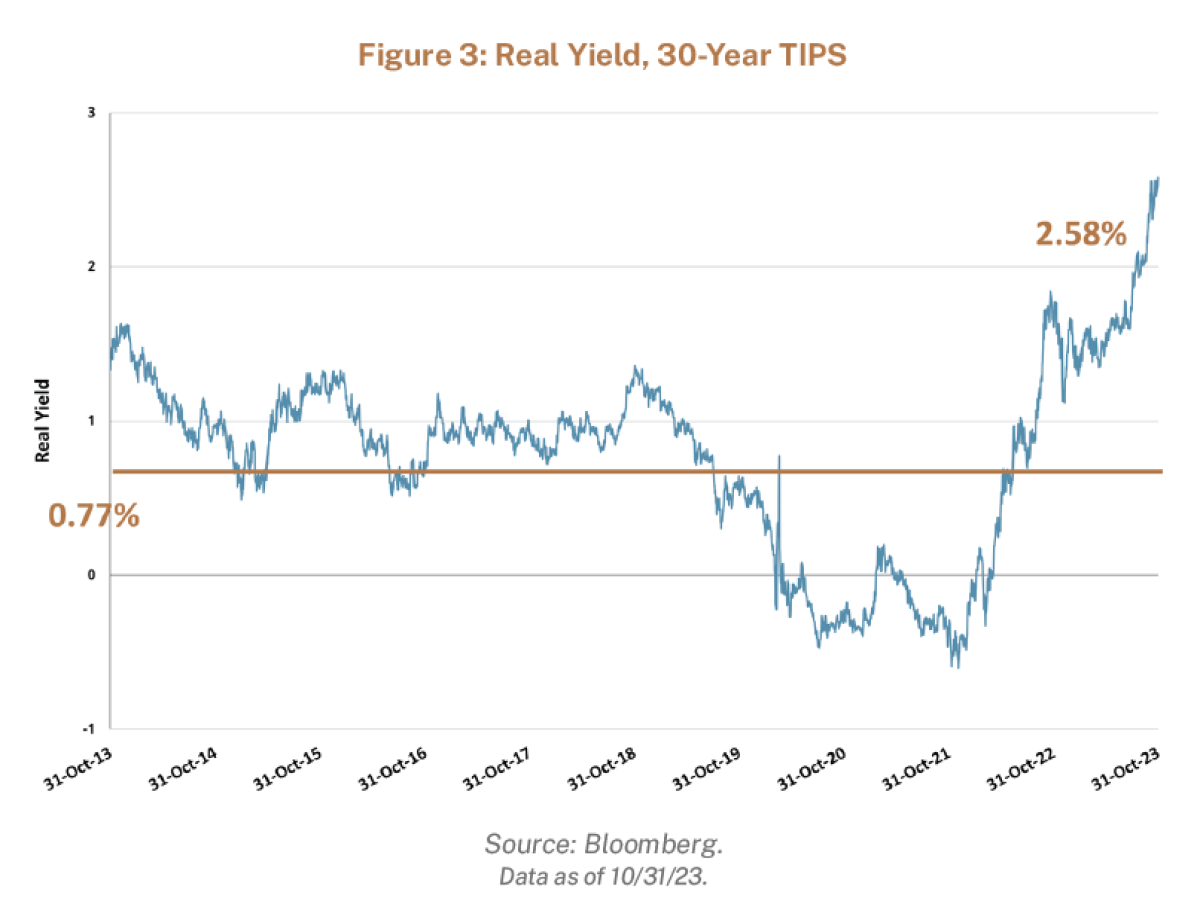
(1) Treasury Inflation-Protected Securities (TIPS)
The real yield on 30-year TIPS has averaged 0.77% over the past decade. With real yields now over 2.5%, TIPS are historically attractive, leading to an overweight versus the index (see Figure 3).
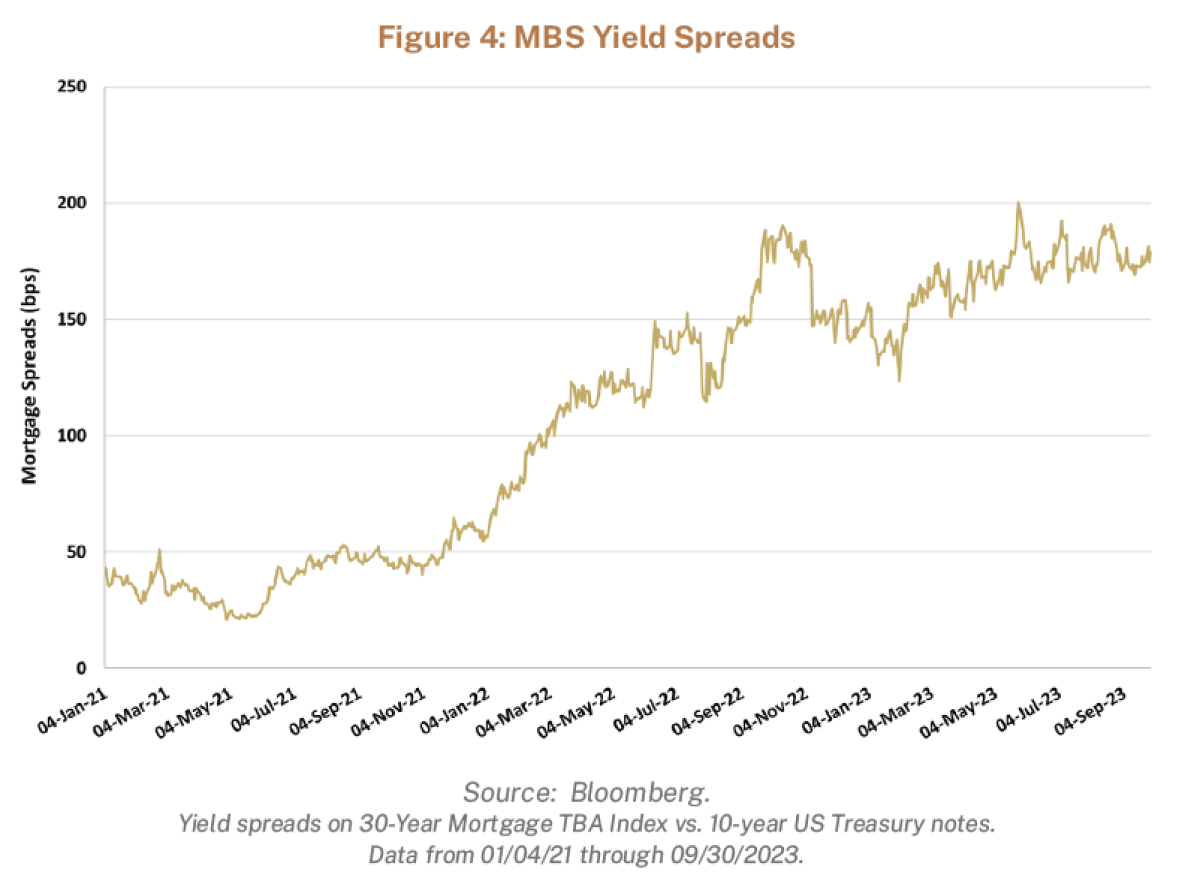
(2) Mortgage-Backed Securities (MBS)
While MBS always yield more than Treasuries due to their prepayment risk, this spread over Treasuries has widened dramatically over the past couple of years, making them more attractive (see Figure 4).
Step 2
Now that the fund has overweighted the higher risk-adjusted yield sectors, the next step is to set the fund’s duration to approximate that of the index. The most efficient way to do this is through Treasury futures.
This step has 3 components:
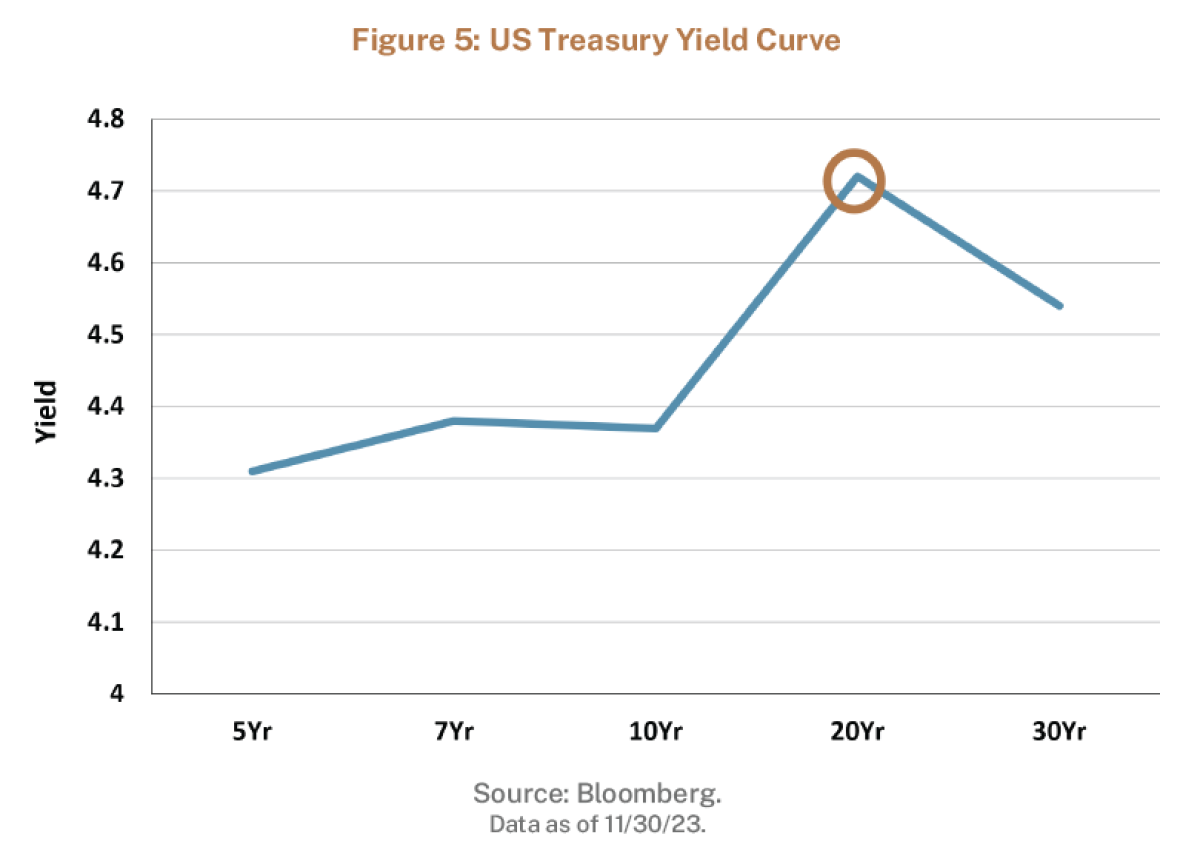
a. Select the most attractive point on the Treasury yield curve
b. Size the position to meet the fund’s duration target
c. Manage the cash collateral to maximize yield
As of November 30, 2023, the most attractive point on the Treasury yield curve is 20 years (see Figure 5), which has higher yields than other points on the curve, as well as attractive carry characteristics. In this example, the fund would favor this portion of the curve while sizing it to an amount that—when combined with the fund’s other holdings—achieves the fund’s target duration.
An important step in managing the Treasury futures exposure is optimizing the cash collateral. AGGH will seek the highest-yielding short-term instruments that can be found without taking on credit risk.
Step 3
The final step in AGGH’s active management process is to enhance yield with a risk-managed options selling strategy.
Investors are probably most familiar with options selling strategies for equities in the form of covered call funds. In fact, the largest actively managed ETF in the industry is an equity-covered call fund. The obvious appeal of these funds is the distribution yields that are significantly higher than most traditional equity funds.
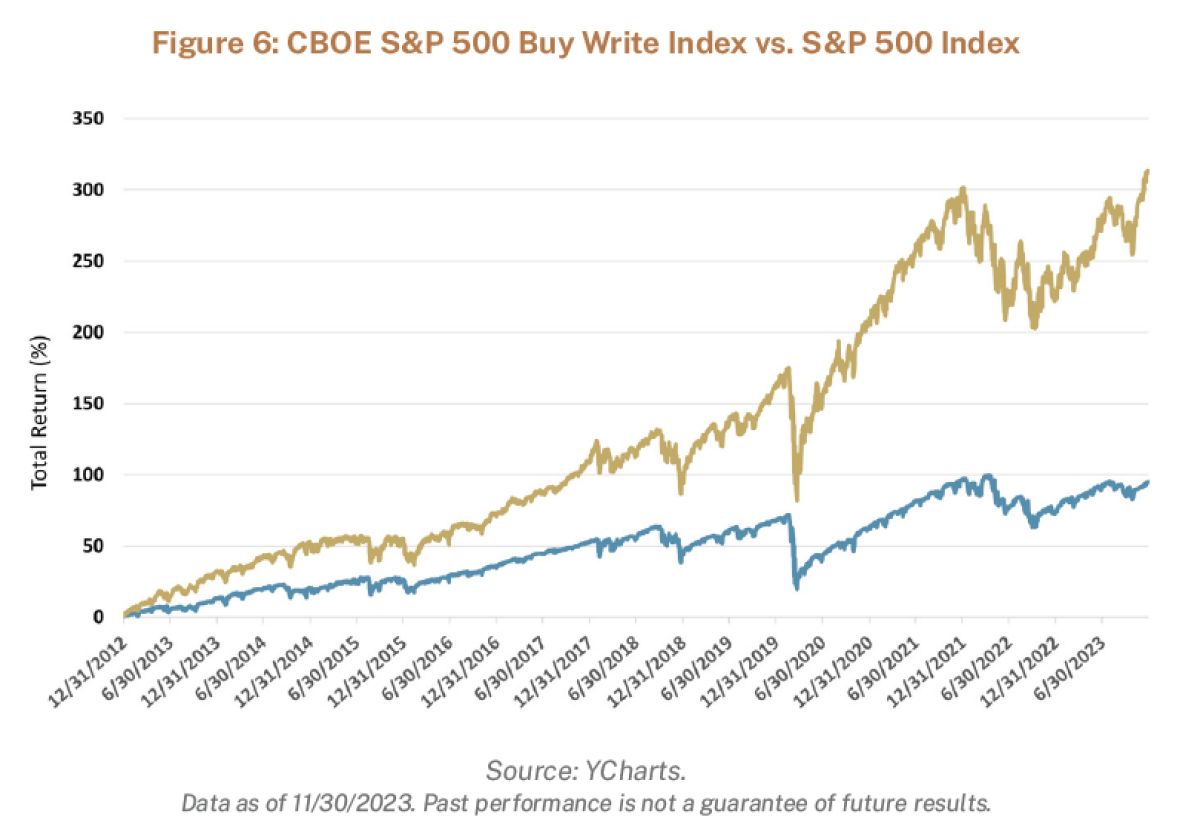
However, the drawback of these funds is that selling calls against the fund positions caps a fund’s potential gains. Since the majority of equity returns over time come from capital appreciation, selling covered calls will lead to underperformance versus the underlying benchmark, even after taking in considerable option premiums.
In Figure 6, we see the total returns over the past decade of the CBOE S&P 500 Buy-Write Index (an index representing a covered call strategy on the S&P 500 Index) versus the S&P 500 Index. Over the past 10 years, the covered call index has significantly trailed its underlying benchmark.
On the other hand, the majority of the returns from fixed income come from coupon payments, not capital appreciation. Selling calls against fixed-income positions is much less likely to impede performance versus the benchmark. In fact, there is a structural opportunity in selling interest rate options versus equity options.
On the equity side, there is high structural demand to sell call options, driven by the massive flows into equity-covered call strategies. On the interest rate side, there is high structural demand to buy call options, mostly driven by dealer hedging. Selling options on the fixed-income side can thus be structurally advantageous in comparison to selling options on equities.
Now let’s run through a hypothetical example of AGGH’s options selling strategy.
1. Simplify identifies an attractive bond market sector with a high risk-adjusted yield. The fund buys an ETF that represents this asset.
2. A price target is identified for the ETF over the next month or two based on fundamental analysis, and call options are sold with a strike price at the target. The strike price would typically be out-of-the-money to allow room for capital appreciation. Selling the option not only provides income, but also provides an exit at the target price.
- If the option expires with the ETF price below the strike price, then it is a “win”, as the fund keeps 100% of the option premium. The fund can then sell another option for even more income.
- If the ETF increases in price and hits the strike price, it’s also a win, as (a) the fund has earned option premium and (b) the fund exits the position at the desired price. The assets can then be redeployed into a new position with attractive risk-adjusted yield and repeat the process.
Contrast this with a strategy that, for example, mechanically sells a 2% out-of-the-money call option every month on the same underlying asset regardless of market conditions. If the underlying asset rallies in price, the fund would be forced to repurchase those options at a loss or sell the asset at the strike price and immediately repurchase it at a new, higher price.
3. In addition to selling call options, the fund might also sell out-of-the-money put options. This also provides option income. In addition, it ensures that the fund will purchase more shares should they become available at even more attractive prices. The goal of the strategy is to provide not only a significantly higher distribution yield than the underlying index, but a higher total return as well.
AGGH USE CASES
Many investors are comfortable holding the Aggregate Bond Index as their sole fixed-income position due to its diversification and high credit quality. As a core bond fund with similar duration and credit characteristics as the Aggregate Bond Index, AGGH has two simple use cases:
- As a complement to an investor’s other fixed-income holdings with a goal of increasing yield and total return.
- As an investor’s sole fixed-income position. For an investor holding a typical 60/40 portfolio, it is reasonable to use AGGH as the only fund representing the “40”.
SUMMARY
While interest rates have risen across the board over the past few years, they remain relatively modest. As of December, 2023, bond index funds maintain distribution yields barely above 3%.
Against this backdrop, AGGH has the opportunity to deliver significantly higher yields without taking on any additional duration or credit risk.
About the Author:
Larry Kim has spent his entire career in the financial services industry in a variety of roles. Previously, he was a senior consultant at Fidelity Institutional, where he advised large banks and insurance companies on how to set up and optimize their managed account programs. Other roles at Fidelity included National Sales Manager of Fidelity mutual funds, VP of financial planning, fund wholesaler, and VP of product management, where he launched over twenty of Fidelity's mutual funds. At Simplify, Larry works with financial advisors and institutional investors on understanding the Simplify product lineup and how to implement them in client portfolios.
Larry has an MBA from the Leonard N. Stern School of Business at New York University and a bachelor's degree from Oberlin College.