
By Nicolas Rabener, CAIA, CEO & Founder of Finomial.
SUMMARY
- Covered call strategies aim to offer index-like returns with lower volatility and higher yields
- They have underperformed their benchmarks significantly over longer periods
- They are tools for market timing, but that is difficult to execute successfully
INTRODUCTION
JP Morgan has been a late-comer to the ETF industry, but achieved remarkable success in the actively-managed ETF space as it manages the two largest products, namely the JPMorgan Equity Premium Income ETF (JEPI) with $26 billion and JPMorgan Ultra-Short Income ETF (JPST) with $24 billion of assets under management.
Intuitively, investors might have expected growth or value-focused products from well-known active managers like Fidelity or PIMCO to dominate, but instead, JEPI represents a covered call strategy.
JEPI represents a portfolio of large-cap stocks that is combined with selling call options to generate monthly income. The objective, like for all covered call strategies, is to offer index-like returns with lower volatility but higher dividends. In this research article, we will explore if covered call products have been able to meet these goals.
UNIVERSE
We consider all funds trading in the US that pursue covered call strategies, which is a universe of 28 mutual funds and ETFs. The combined assets under management are $52 billion, although JEPI dominates with its $26 billion. Annual management fees are 0.78% on average, but range from 0.35% to 1.20%.
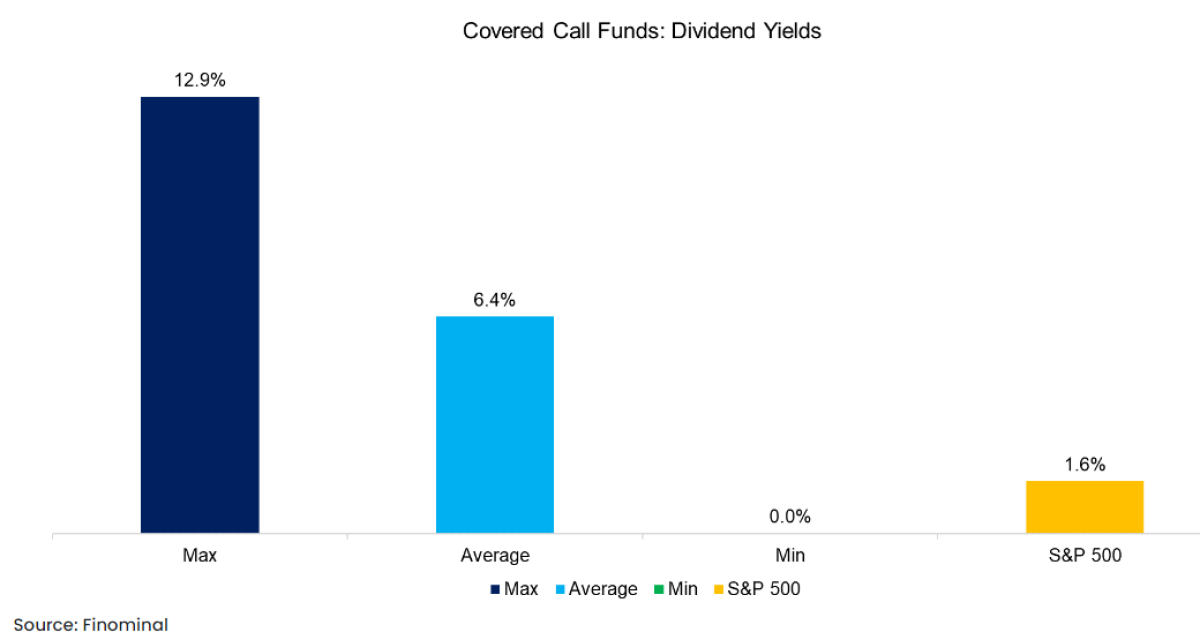
Most investors use covered call strategies when they believe stock markets will be trading sideways in the short to medium-term, where the upside is limited but the total portfolio return can be enhanced by selling call options. Given this, the average yield of a covered call fund is 6.4%, compared to a mere 1.6% for the S&P 500 (read Resist the Siren Call of High Dividend Yields).
FACTOR EXPOSURE ANALYSIS
In order to learn more about what is driving the returns of covered call funds, we run a simple factor exposure analysis.
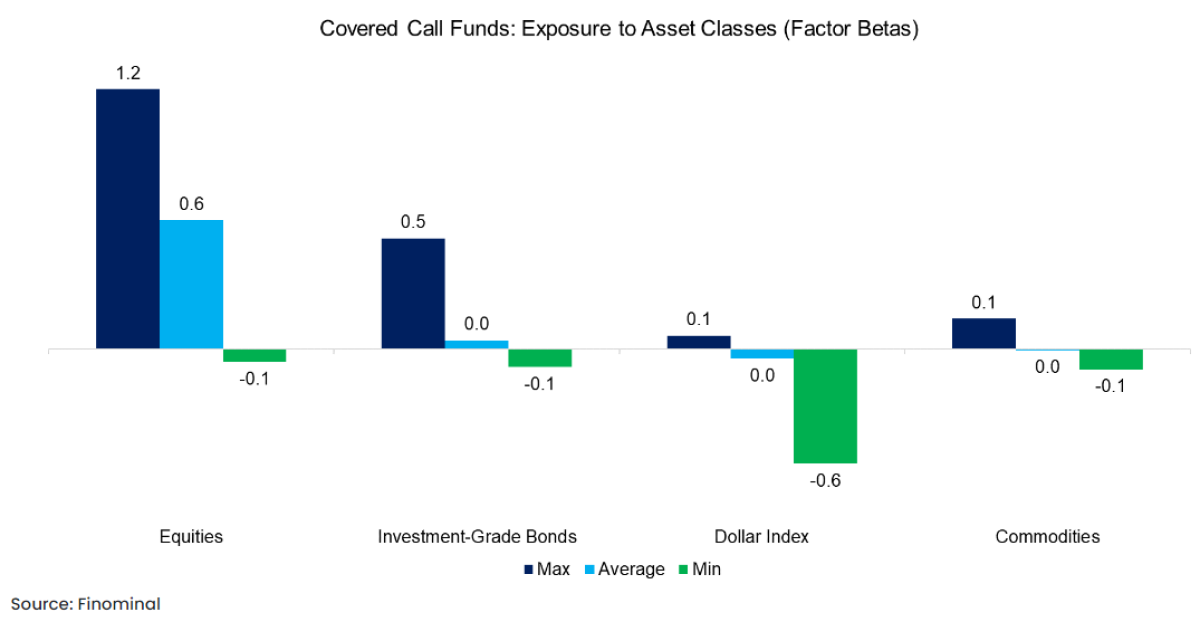
We observe these funds primarily offer exposure to the US stock market, except for one fund, the FT CBOE Vest Gold Strategy Target Income ETF (IGLD), which offers mildly negative exposure to equities as well as strongly negative exposure to the US Dollar Index. Given these results, it seems that covered call strategies represent basically diluted equity exposure with limited diversification benefits.
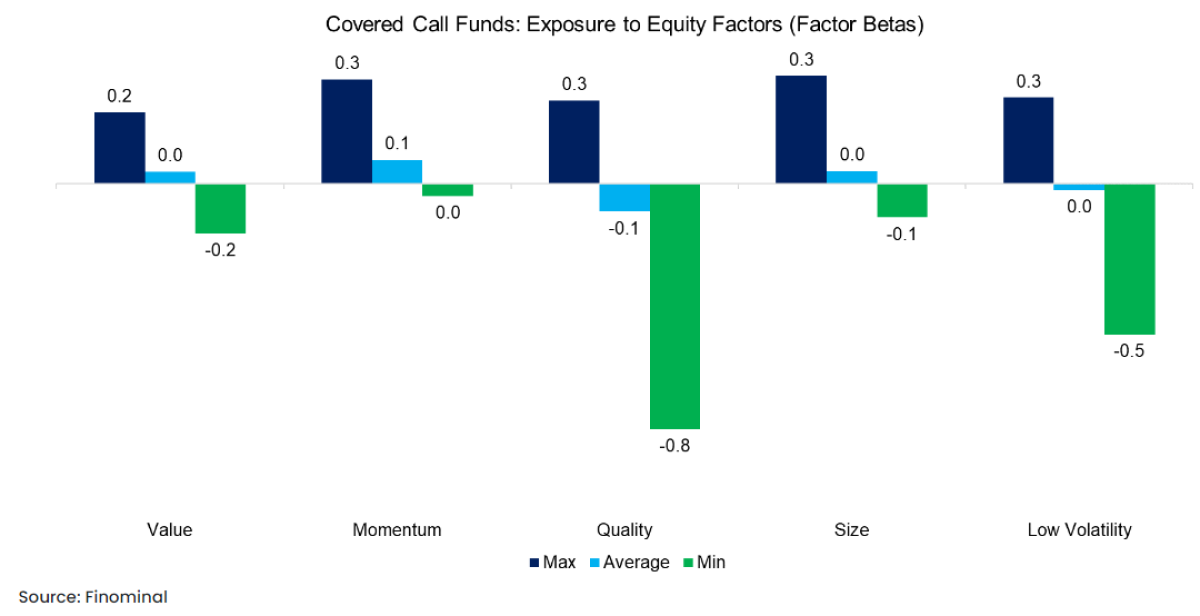
We also analyze the exposure to common equity factors, which highlights that none of these funds has strong biases, except for the Madison Covered Call & Equity Strategy Fund (MCN) which features a strongly negative beta to the quality factor (try Finominal’s Know Your Factors).
The lack of strong factor exposures is to be expected as most of the products hold diversified portfolios of stocks or directly track an index like the S&P 500 or Nasdaq. It is less about stock selection and more about portfolio construction.
BENCHMARKING
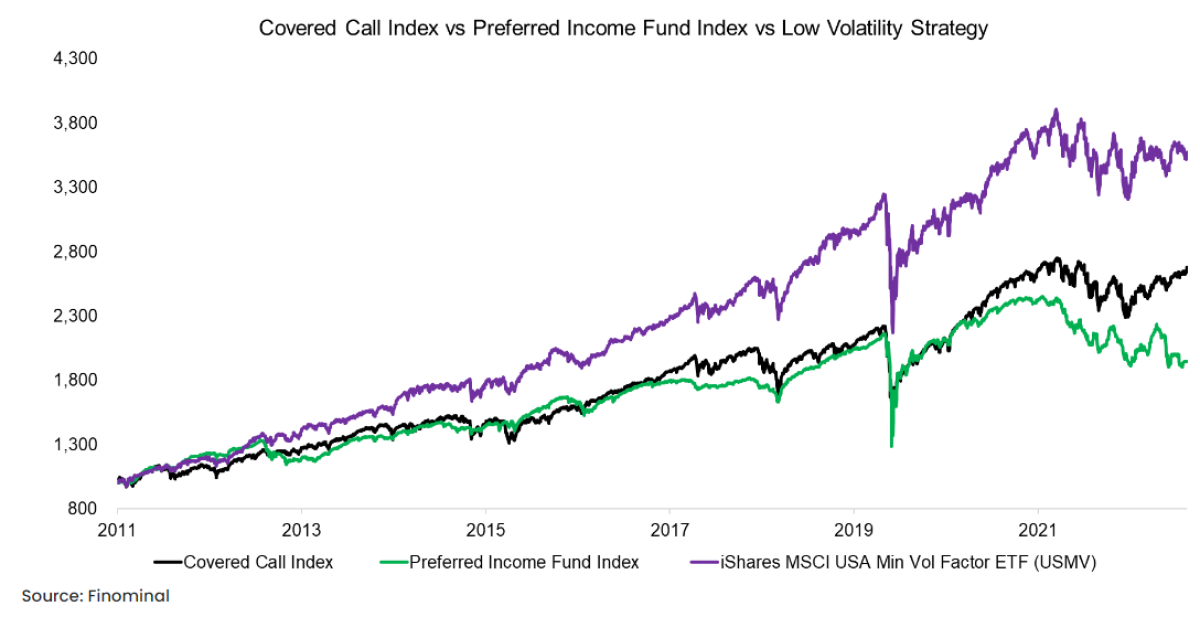
If the objective of covered call products is to offer lower volatility but higher yields than a benchmark index like the S&P 500, then we can compare the strategy to preferred income funds and low volatility products as these have similar goals.
We create an equal-weighted index of all covered call products but exclude the one focused on gold, and observe that the covered call index and preferred income fund index tracked each other closely in the period from 2011 to 2021. Thereafter the preferred income funds underperformed, which can be explained by these suffering more from rising interest rates.
Both strategies offer exceptionally high dividend yields, which are 6.4% for covered call funds and 7.2% for preferred income funds. A low volatility strategy, where we take iShares MSCI USA Min Vol Factor ETF (USMV) as a proxy, is much lower yielding with 2.1%, but would have outperformed both other strategies since 2011, albeit with higher annualized volatilty at 12.8%, versus 12.0% for covered call and 9.2% for preferred income funds.
Naturally, we can also compare covered call funds to the S&P 500, where we notice a significant underperformance in the period between 2004 and 2023, which is expected given that the US stock market was mostly in bull markets throughout that period. Investors would have collected a premium for selling call options, but lost more than that when the options expired as they increased in value.
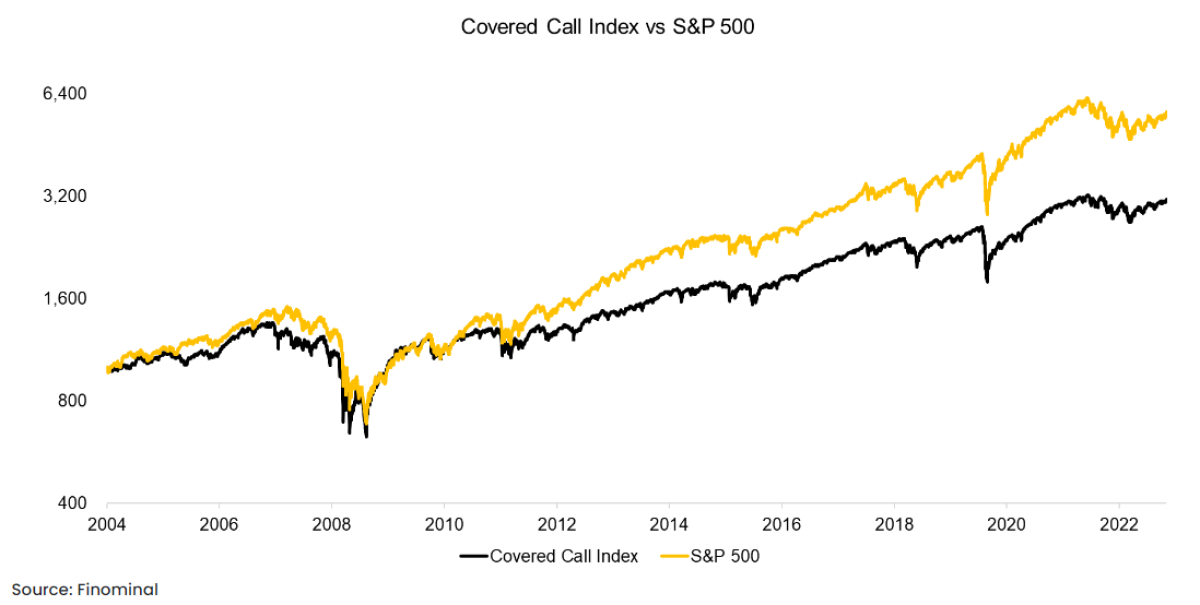
The nature of covered call strategies becomes apparent when computing the annual difference between the covered call index and the S&P 500. In years where stocks declined, eg the global financial crisis in 2008 or the bear market in 2022, the call options expired worthless but did provide investors with additional income that reduced the drawdowns.
However, we also observe a consistent lag in returns compared to the S&P 500 during the long bull market between 2009 and 2022.
FURTHER THOUGHTS
Usually, high yields are associated with high risks and are not worth pursuing. In contrast, covered call strategies seem to offer diversified portfolios that resemble the S&P 500 and Nasdaq, including popular stocks like Apple or Amazon. Given this, getting a 6% yield from a covered call strategy may seem more enticing than from a company in trouble or a sector that has fallen out of favor.
However, both high dividend-yielding and covered call strategies have underperformed the broader stock market over longer time periods, which means income was traded against a lower total return. Any investor can create income by simply selling a small stake of their portfolio, which is also favorable from a taxation perspective as capital gains tend to have lower tax rates than income.
Furthermore, covered call strategies are typically used by investors that expect markets to trade sideways, but that is explicit market timing and who is good at that?
RELATED RESEARCH
Preferential Times for Preferred Income Strategies?
The Case Against Equity Income Funds
Resist the Siren Call of High Dividend Yields
Dividend Yield Combinations
Value Factor: Improving the Tax Efficiency
Factor Exposure Analysis 101
About the Author:
Nicolas Rabener is the founder & CEO of Finomial (formerly FactorResearch) and previously founded Jackdaw Capital, an award-winning quantitative hedge fund. Before that Nicolas worked at GIC and Citigroup. Nicolas holds an MSc from HHL Leipzig Graduate School of Management, is a CAIA charter holder, and enjoys endurance sports (100km Ultramarathon).