


By Stephen L. Nesbitt – Chief Executive Officer, Chief Investment Officer of Cliffwater.
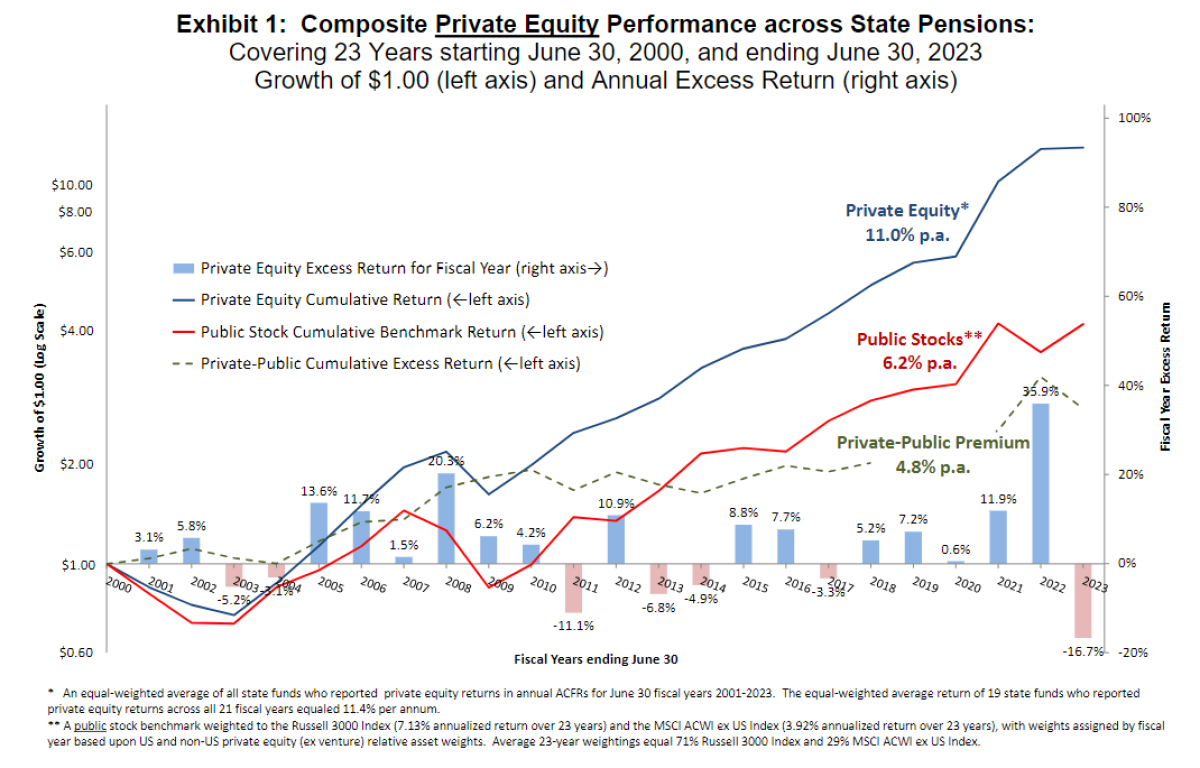
Private equity allocations by state pensions produced a 11.0% net-of-fee annualized return over the 23-year period ending June 30, 2023, exceeding by 4.8% the 6.2% annualized return that otherwise would have been earned by investing in public stocks.
Our annual performance study now includes 20232, a year that produced a modest 0.8% return for private equity compared to a 17.5% return for the public stock market equivalent return. The large shortfall in private equity return for 2023 is due to a valuation spillover from the 2022 drawdown in public stock values. A two-year lookback shows private equity earning a 10.3% annual return compared to 0.2% for the public stock market equivalent.
Private Equity Performance
Exhibit 1 plots cumulative returns3 for the Private Equity Composite, the Public Stock Benchmark, and the return difference (excess return) between private and public equities. Annualized returns for the entire 23-year period are reported. The 11.0% annualized return for private equity for the entire 23-year period is impressive compared to the 6.2% annualized return for the Public Stock Benchmark and the resulting 4.8% annualized return difference exceeds the 3% annual premium or excess return generally associated with return objectives for private equity. Also shown in Exhibit 1 are bars representing individual fiscal year return differences (“excess returns”) between the Private Equity Composite and Public Stock Benchmark.
Study Data and Design
We draw our findings from data provided in Annual Comprehensive Financial Reports (“ACFRs”) published by 94 state pension systems. We selected this data source because, unlike commonly used commercial universes, it is a closed group with no selection biases, and represents actual results achieved by large institutional investors. The list of 94 is narrowed to 65 state systems that use the same June 30 fiscal year-end date so to achieve consistent performance measurement periods. Nineteen (19) of the 65 state systems operated private equity portfolios for all 23 fiscal years. Private equity holdings for the study group grew from approximately $60 billion (4% of $1.6 trillion in total study assets) to approximately $500 billion (15% of $3.2 trillion in total study assets).
The study period was selected partly for ease of data collection but also because it covers three full market cycles, encompassing three bear markets and three bull markets. We create a “Private Equity Composite” return series calculated by taking the average of all state systems reporting private equity portfolio returns for that fiscal year. The number of state systems included in the yearly average grew steadily over the study period from 19 to 61.
Most state systems have a private equity objective to out-perform public equity by some percentage point amount, the most frequent amount being 300 basis points (3%), net of all fees. The 3% incremental return is intended to compensate investors for the loss of liquidity and complexity associated with private equity, but investors do differ on the appropriate return spread for private equity over public equity. The equity index used to represent public equity varies as well with some state systems targeting a U.S. benchmark like the S&P 500 or Russell 3000 Index and others using a global equity index like the MSCI ACWI ex US Index.
We create a “Public Stocks Benchmark” by calculating a weighted average of the Russell 3000 Index and the MSCI ACWI ex US Index, rebalanced annually. The weights vary by year, based upon Cambridge Associates reporting of US and non-US private equity assets for buyouts and distressed debt. The average weightings to the Russell 3000 and MSCI ACWI ex US indices were 71% and 29%, respectively, for the entire period. Yearly Russell 3000 weightings ranged from 65% to 82%.
The return calculations in this study follow the reporting practices of state pension systems as described in most ACFRs. Reported fiscal year private equity returns are typically internal rates of return, which are then linked in a time-weighted fashion to create multiperiod returns. The internal rate of return calculation is often used in measuring private equity performance in part because it represents a better measure of return when cash flows are very large in relation to portfolio values and because managers control the timing of cash flows. These two conditions are less relevant for state private equity portfolios that aggregate many underlying private equity funds. First, aggregated private equity cash flows (both inflows and outflows) tend to be modest relative to the size of the overall portfolio. Second, at the aggregate level the timing of cash flows is also controlled by the pension system itself through its “capital budgeting.” For example, a fund manager’s eagerness to distribute cash proceeds may be offset by increased new fund
commitments by the pension system to preserve “vintage diversification.”
Convergence
Not too long ago, a familiar narrative was that private equity returns were failing to deliver the excess return over public stocks compared to years past. Our study finds no such evidence. Private equity returns are tested for convergence through a simple regression analysis that uses fiscal private equity excess returns reported in Exhibit 1 as the dependent variable and time as the independent variable. The regression result incorporating all 23 yearly excess returns shows a positive, and statistically insignificant, coefficient for excess return and time. Convergence may be a legitimate investor concern, but there is no evidence of its
presence in state pension returns.
Strong performance from private equity is expected. Private asset classes, including private equity, private debt, and private real estate, should outperform their public equivalents as investors demand higher returns for loss of liquidity. This “illiquidity premium” has generally been estimated at two percentage points in extra return across private asset classes.
Conclusion
Our updated study focuses on the private equity performance achieved by large state pension systems over a 23 fiscal year period from 2000 to 2023. This data is different from return universe data available on individual private equity funds which ignores selection, weighting, co-investment, and other decision factors that state pensions make in managing a private equity portfolio.
The study finds that private equity produced a meaningful 4.8% annualized excess return over public equity. We test for any diminution of excess return over time and find no evidence of private equity and public stock return convergence. Private equity has consistently been one of the strongest performing asset classes within state pension portfolios.
Footnotes:
1. This is the seventh edition of our private equity performance report, which was first printed in 2017.
2 Fiscal year 2023 from June 30, 2022, to June 30, 2023.
3 Cumulative returns are presented in Exhibit 1 using a “Growth of $1.00” scale, measuring how an initial $1.00
investment would have grown if it earned the average private equity return of reporting state systems or the Public
Stocks Benchmark return.
4 MSCI ACWI Index represents all global public equity markets. The MSCI ACWI ex US Index excludes the US equity
market. “ACWI” is an acronym for All Country World Index.
Steve Nesbitt is the Chief Executive Officer and Chief Investment Officer of Cliffwater, and is primarily responsible for the day-to-day management of Cliffwater Corporate Lending Fund (CCLFX) and the Cliffwater Enhanced Lending Fund (CELFX), an SEC registered credit interval fund focused on the US corporate middle market.

Steve is recognized for a broad range of investment research. His papers have appeared in the Financial Analysts Journal, The Journal of Portfolio Management, The Journal of Applied Corporate Finance, and The Journal of Alternative Investments. His private debt research led to the creation of the Cliffwater BDC Index, measuring historical BDC performance, and the Cliffwater Direct Lending Index, measuring historical performance for direct middle market loans. Steve authored the book, Private Debt: Opportunities in Corporate Direct Lending, Wiley Finance (2019) which provides the analytical and empirical underpinnings of the private debt market.
Stephen L. Nesbitt snesbitt@cliffwater.com
The views expressed herein are the views of Cliffwater LLC (“Cliffwater”) only through the date of this report and are subject to change based on market or other conditions. All information has been obtained from sources believed to be reliable, but its accuracy is not guaranteed. Cliffwater has not conducted an independent verification of the information. The information herein may include inaccuracies or typographical errors. Due to various factors, including the inherent possibility of human or mechanical error, the accuracy, completeness, timeliness and correct sequencing of such information and the results obtained from its use are not guaranteed by Cliffwater. No representation, warranty, or undertaking, express or implied, is given as to the accuracy or completeness of the information or opinions contained in this report. This report is not an advertisement, is being distributed for informational purposes only and should not be considered investment advice, nor shall it be construed as an offer or solicitation of an offer for the purchase or sale of any security. The information we provide does not take into account any investor’s particular investment objectives, strategies, tax status or investment horizon. Cliffwater shall not be responsible for investment decisions, damages, or other losses resulting from the use of the information. Past performance does not guarantee future performance. Future returns are not guaranteed, and a loss of principal may occur. Statements that are nonfactual in nature, including opinions, projections, and estimates, assume certain economic conditions and industry developments and constitute only current opinions that are subject to change without notice. Cliffwater is a service mark of Cliffwater LLC.